Zinger Key Points
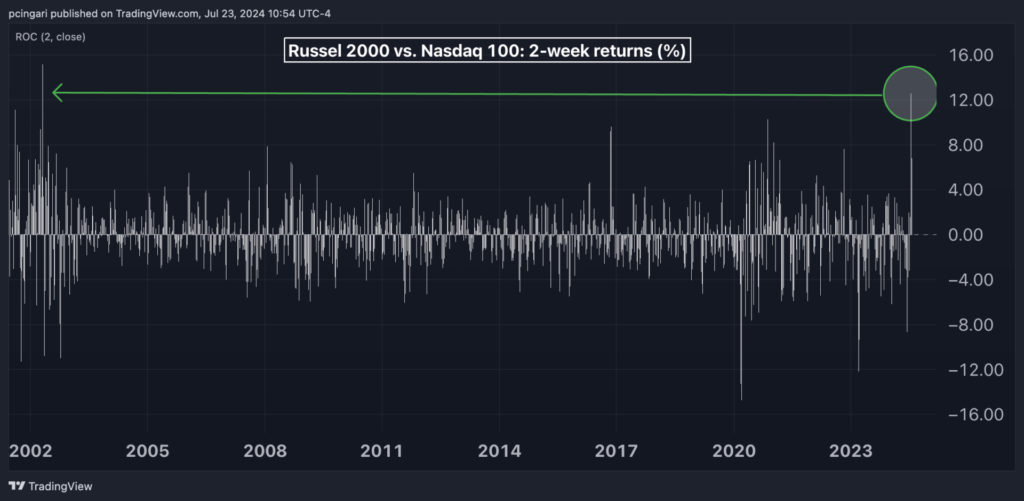
- The Russell 2000 index showed its strongest two-week outperformance versus the Nasdaq 100 since May 2002.
- July 2024 is now the second-best month for small-cap versus tech performance since April 2002, only behind November 2016.
- Markets are swinging wildly, but for Matt Maley, it's just another opportunity to trade. His clear, simple trade alerts have helped members lock in gains as high as 100% and 450%. Now, you can get his next trade signal—completely free.
Investors are moving from large-cap tech stocks to small-cap equities.
The trend comes amid heightened expectations that the Federal Reserve will lower interest rates as early as September.
In the week ending July 18, the Russell 2000 index — as tracked by the iShares Russell 2000 ETF IWM — showcased its highest two-week outperformance relative to the Nasdaq 100 index since May 2002.
July 2024 is now the second-best month in the small-cap versus tech performance since April 2002, surpassed only by November 2016.
Chart: Small Caps Posted Largest 2-Week Rally Versus Tech In Over 2 Decades

Analyst Remarks
Goldman Sachs analyst Andrea Ferrario credits this rotation to declining Treasury yields, driven by softer U.S. Consumer Price Index (CPI) report, and weaker labor market data.
In June, the CPI report marked the first month-over-month decline since May 2020, pushing market-implied expectations of a September rate cut to nearly 100%.
Ferrario also noted that extreme positioning shifts likely amplified the Russell 2000’s outperformance versus the Nasdaq.
Prior to the CPI release, CFTC data indicated neutral positioning in the Russell 2000 for mutual funds and short positioning for hedge funds, which turned more bullish post-report.
Goldman Sachs suggests that a Republican sweep on Election Day — the U.S. presidency and Congress — and the narrowing growth premium of large-cap stocks could favor the Russell 2000 relative to the S&P 500 going forward.
Additionally, concerns about market concentration in big tech and the sustainability of future AI investment returns are also driving this shift.
Bank of America equity analyst Jill Hall emphasizes two conditions for a sustained rally in the Russell 2000: continued easing of inflation, as evidenced by the June CPI data, and stronger profit expectations.
Light positioning in small caps and supportive relative valuations suggest that the focus may shift to fundamentals as 2Q earnings reports are released.
“Lack of improvement could suggest a pause in outperformance, but if we see better guidance/revisions, the rally likely continues,” Hall wrote.
According to the expert, short-covering was a key driving factor behind the rally, with the biggest leaders being leveraged stocks (high Net Debt/Market Cap and Net Debt/Equity, +15-16%) and high-risk factors (High Beta and High Price Volatility, +16-18%).
‘Small-Cap Stocks Stand To Benefit’
Comerica’s analyst team, led by CIO John Lynch, commented, “Small-cap stocks stand to benefit more than large-cap stocks from lower interest rates as roughly 40% of companies in the Russell 2000 index are unprofitable and thus more dependent on capital market financing to fund operations.”
“The political landscape has also played a role in the small-cap rally. Increasing odds of a Republican administration is seen as a benefit for smaller companies which stand to benefit more from the prospect of lower taxes and less regulation,” Comerica added.
Historical data shows that the best scenarios for small caps occur when interest rate cuts are not accompanied by an economic recession.
Past rate-cutting cycles have often been challenging for the Russell 2000 index. Since 1981, the index has averaged a -1.5% return in the 12 months following the first Fed rate cut of a cycle, with the notable exception of 1995, when a recession did not follow and the index rallied 20.2% over the next year.
Currently, small-cap stocks are trading at attractive valuations compared to their larger counterparts, according to Comerica. Large caps are significantly more expensive than their historical averages, making small caps appealing for investors seeking growth opportunities at lower prices.
| First Cut | Fwd. 12 Mo. Return | Recession |
|---|---|---|
| 6/1/1981 | -20.99% | Yes |
| 10/2/1984 | 8.93% | Yes |
| 6/5/1989 | -1.16% | Yes |
| 7/6/1995 | 20.25% | No |
| 1/3/2001 | 3.79% | Yes |
| 9/18/2007 | -15.04% | Yes |
| 8/1/2019 | -3.15% | Yes |
| Average | -1.05% |
Now Read:
Edge Rankings
Price Trend
© 2025 Benzinga.com. Benzinga does not provide investment advice. All rights reserved.
Trade confidently with insights and alerts from analyst ratings, free reports and breaking news that affects the stocks you care about.