
Zinger Key Points
- Qualcomm’s stock faces bearish signals with prices below key moving averages but holds long-term bullish potential.
- Analysts project a 34.68% upside for Qualcomm, despite current bearish technical indicators.
- Markets are swinging wildly, but for Matt Maley, it's just another opportunity to trade. His clear, simple trade alerts have helped members lock in gains as high as 100% and 450%. Now, you can get his next trade signal—completely free.
Wall Street expects Qualcomm Inc QCOM to report $2.25 in earnings per share and $9.21 billion in revenues as the company reports third-quarter earnings after market hours.
The stock is up 26.31% over the past year — 15.43% YTD.
Let’s look at what the charts indicate for the company’s stock, and how it currently maps against Wall Street estimates.
Further Bearish Movement
Qualcomm stock is currently experiencing a strongly bearish trend. Its share price of $166.94 remains below its 5, 20, and 50-day exponential moving averages. This indicates ongoing selling pressure and the potential for further bearish movement.
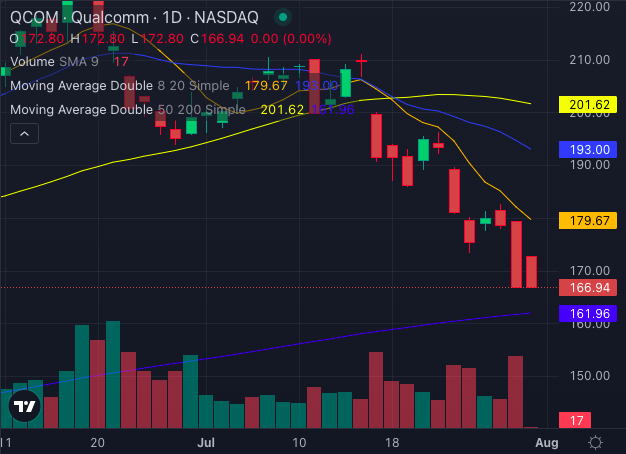
Chart created using Benzinga Pro
The eight-day simple moving average stands at $179.67, the 20-day SMA at $193.00, and the 50-day SMA at $201.62, all suggesting a bearish signal.
However, the stock price is still above the 200-day SMA of $161.96, which provides a bullish signal over the long term.
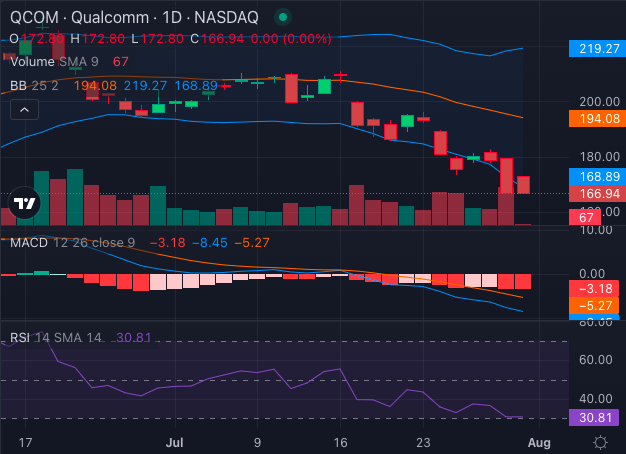
Chart created using Benzinga Pro
The Moving Average Convergence Divergence (MACD) indicator reads -8.45, reinforcing the bearish sentiment.
The Relative Strength Index (RSI) at 30.81 indicates that Qualcomm is oversold, suggesting that selling pressure may soon diminish.
Additionally, the Bollinger Bands range from $168.89 to $219.27, and the stock trades in the lower band – further supporting a bearish outlook.
Despite the long-term bullish signal, the overall technical indicators point to a bearish trend with potential risks.
Read Also: Qualcomm Analyst Predicts 34% Upside: ‘Share Price Pullback Offers Entry Point’
Qualcomm Analysts See 35% Upside
Ratings & Consensus Estimates: The consensus analyst rating on Qualcomm stock stands at a Buy currently with a price target of $194.63. Recent analyst ratings from Baird, Susquehanna, and HSBC suggest a 34.68% upside for Qualcomm Inc, with an average price target of $233.33.
Price Action: Qualcomm stock closed the trading day of Tuesday at $166.94, down 6.55%.
Read Next:
Edge Rankings
Price Trend
© 2025 Benzinga.com. Benzinga does not provide investment advice. All rights reserved.
Trade confidently with insights and alerts from analyst ratings, free reports and breaking news that affects the stocks you care about.

