Below is a list of 10 small cap stocks with a positive earnings trend. I use stockscreen123 as a tool and screener to find small cap value stocks with recent earnings surprises.
I define value as a stock with a projected current year PE of under 20 and a Price to Earnings growth ratio under 1. Small cap is defined as having a market capitalization under $1 billion. The earnings surprises are defined as stocks which have beaten estimates the past 2 quarters and have an average earnings surprise of 20% or more for the past 4 quarters. I also require stocks to be trading above their 200 day simple moving average.
Last month's portfolio of 10 stocks can be seen here or on the right hand side of Scott's Investments. Last month the list performed returned 1.37% (excluding any dividends and commissions/taxes).
Why do I track this screen? I find PEG an effective ratio for identifying growth stocks at a reasonable value. In addition, a recent history of earnings increases could, in theory, help identify companies with the ability to continue to surprise. Backtesting this screen with a rebalance period of every 4 weeks and a maximum position size of 10% (in instances where less than 10 companies qualify) has produced solid 5, 3, and 1 year returns (see December's list for a backtest). A quick visual inspection shows this screen has done well as a high beta play - outperforming in positive market environments and struggling in down markets. Also, a 4 week rebalance period can lead to high turnover and transaction costs.
I exclude OTC stocks and I further narrow the list based on additional stockscreen123 fundamental factors ("Quality-Value-Growth") to 10 stocks or less. The list, as always, is not a specific portfolio but a recommendation for further research. Since this is a purely mechanical screen, I play no discretion in the results (other than establishing the original screen criteria).
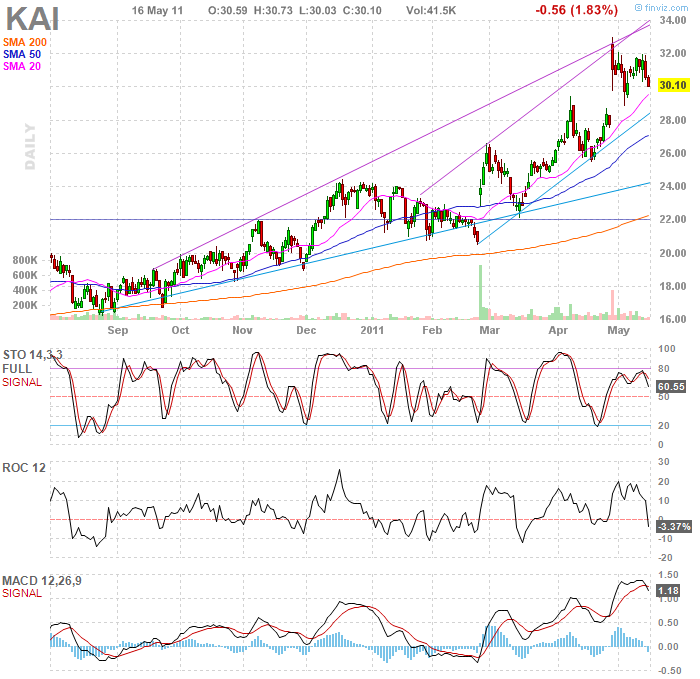
Last month I featured Hi-Tech Pharmacal (HITK) and it remains on this month's list. Kadant Inc (KAI) was on last month's list and on several lists in previous months. In fact, KAI appeared on this screen the first time it was publicly tracked on Scott's Investments. At that time, it traded at $13.91 (11/15/09). Today it closed at $30.10. Kadant Inc. develops, manufactures, and markets equipment and products for the papermaking and paper recycling industries. It currently trades at a forward Price/Earnings ratio of 11.76 and is projected to grow earnings next year at 17.43% after growing earnings the past 5 years at 16.12%. It currently has no long-term debt and remains in an upward trend:
Chart courtesy of Finviz
No positions
Follow me on Twitter!


Market News and Data brought to you by Benzinga APIsI define value as a stock with a projected current year PE of under 20 and a Price to Earnings growth ratio under 1. Small cap is defined as having a market capitalization under $1 billion. The earnings surprises are defined as stocks which have beaten estimates the past 2 quarters and have an average earnings surprise of 20% or more for the past 4 quarters. I also require stocks to be trading above their 200 day simple moving average.
Last month's portfolio of 10 stocks can be seen here or on the right hand side of Scott's Investments. Last month the list performed returned 1.37% (excluding any dividends and commissions/taxes).
Why do I track this screen? I find PEG an effective ratio for identifying growth stocks at a reasonable value. In addition, a recent history of earnings increases could, in theory, help identify companies with the ability to continue to surprise. Backtesting this screen with a rebalance period of every 4 weeks and a maximum position size of 10% (in instances where less than 10 companies qualify) has produced solid 5, 3, and 1 year returns (see December's list for a backtest). A quick visual inspection shows this screen has done well as a high beta play - outperforming in positive market environments and struggling in down markets. Also, a 4 week rebalance period can lead to high turnover and transaction costs.
I exclude OTC stocks and I further narrow the list based on additional stockscreen123 fundamental factors ("Quality-Value-Growth") to 10 stocks or less. The list, as always, is not a specific portfolio but a recommendation for further research. Since this is a purely mechanical screen, I play no discretion in the results (other than establishing the original screen criteria).
Last month I featured Hi-Tech Pharmacal (HITK) and it remains on this month's list. Kadant Inc (KAI) was on last month's list and on several lists in previous months. In fact, KAI appeared on this screen the first time it was publicly tracked on Scott's Investments. At that time, it traded at $13.91 (11/15/09). Today it closed at $30.10. Kadant Inc. develops, manufactures, and markets equipment and products for the papermaking and paper recycling industries. It currently trades at a forward Price/Earnings ratio of 11.76 and is projected to grow earnings next year at 17.43% after growing earnings the past 5 years at 16.12%. It currently has no long-term debt and remains in an upward trend:
Chart courtesy of Finviz
| Ticker | Name | Rank | Mkt Cap | Proj PE Cur FY | PEG LT |
| LTXC | LTX-Credence Corporation | 98.68 | 430.33 | 8.32 | 0.52 |
| HITK | Hi-Tech Pharmacal Co. | 97.78 | 331.76 | 8.98 | 0.66 |
| SMRT | Stein Mart, Inc. | 97.74 | 425.23 | 13.72 | 0.76 |
| RCKY | Rocky Brands, Inc. | 97.5 | 104.07 | 9.75 | 0.97 |
| ASYS | Amtech Systems, Inc. | 97.44 | 223.48 | 9.21 | 0.26 |
| KEM | KEMET Corporation | 96.72 | 612.57 | 7.46 | 0.62 |
| KAI | Kadant Inc. | 96.04 | 377.24 | 14.5 | 0.69 |
| BTUI | BTU International, Inc. | 96.01 | 85.05 | 16.58 | 0.83 |
| LAD | Lithia Motors, Inc. | 95.25 | 450.29 | 11.86 | 0.41 |
| AVAV | AeroVironment, Inc. | 94.21 | 627.14 | 27.11 | 0.71 |
No positions
Follow me on Twitter!
© 2024 Benzinga.com. Benzinga does not provide investment advice. All rights reserved.
Comments
Loading...
Benzinga simplifies the market for smarter investing
Trade confidently with insights and alerts from analyst ratings, free reports and breaking news that affects the stocks you care about.
Join Now: Free!
Already a member?Sign in

