Despite an increasingly volatile market, Nike Inc NKE has held up pretty well in 2018. The stock closed Thursday's session up 1.41 percent, bringing its year-to-date gains up to 7.8 percent.
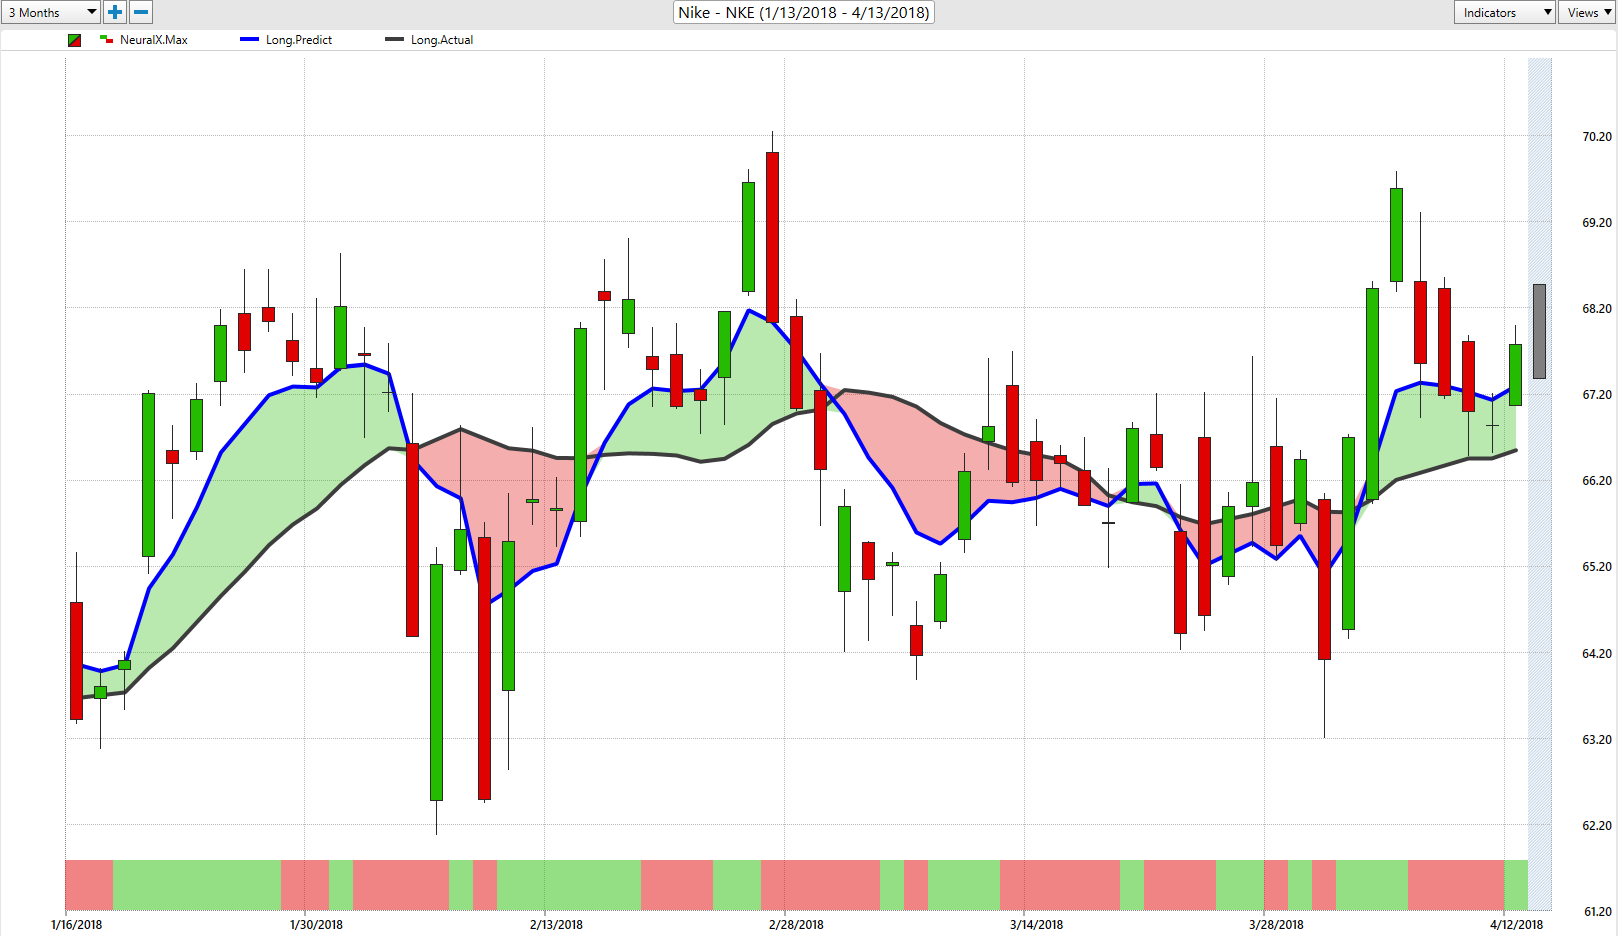
The three-month chart of Nike below shows a couple of things that would indicate the stock has room to move higher.

First, we had a bullish crossover indicated by the blue predictive indicator line crossing above the black simple moving average on April 9th. This tells us that the stock has entered an uptrend.
The red-green Neural Index at the bottom of the chart shows strength or weakness over a 48-hour period. Despite some weakness in the stock this week, Thursday's trading represents a turning point. Based on that the index shifted to green, telling us we can expect Nike to move higher on Friday (as represented by the gray candle, which predicts Friday's range).
These indicators tell us Nike could be primed for more upside, and is a stock we'll be watching for now.
VantagePoint is an editorial partner of Benzinga. For a free demo of the platform, click here.
© 2025 Benzinga.com. Benzinga does not provide investment advice. All rights reserved.
Trade confidently with insights and alerts from analyst ratings, free reports and breaking news that affects the stocks you care about.