
After a rough start to 2019, Tesla Inc TSLA investors have a key fundamental catalyst on the horizon this week when the company reports its first-quarter vehicle deliveries. Before the big numbers come out, Tesla traders should know the key technical levels to be watching in the stock’s chart.
Technical Trends
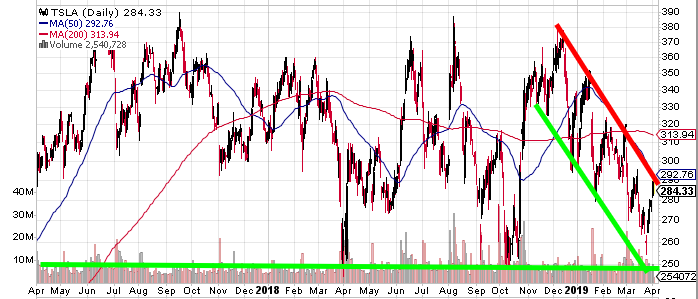
With Tesla shares down 14.3 percent year to date, it’s not surprising the near-term technical trends in the stock’s chart are bearish. The chart below shows the series of lower highs and lower lows in the Tesla chart that has formed a bearish channel going back to November 2018.
Tesla recently traded near both the top of this bearish channel and tested its 50-day simple moving average by peaking near $290 Tuesday before turning lower once again. Tesla last tested the bottom of the channel when it bounced in the $255 range a few weeks ago.
In the longer term, the technical picture for Tesla is much more neutral. The chart below shows how Tesla has been range-bound in a wide and volatile horizontal trading range for nearly three years now.
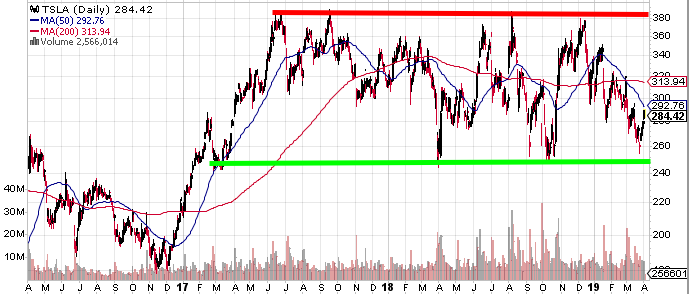
Tesla has tested the top of this trading range in the $380 to $390 range on at least four separate occasions: June 2017, September 2017, August 2018 and December 2018. Each time it failed to break out to new highs.
The bottom of the long-term trading range is all the way down at around $245 to $255. Tesla consistently found support at this level in April 2018, October 2018 and most recently in March.
The bearish near-term trend and the longer-term trading range are set for a collision course over the next few weeks. The top of the bearish channel and the horizontal support at $250 are forming a descending triangle pattern. The descending triangle is typically bearish in nature, ultimately resulting in a breakdown of support.
2 Key Levels
Tesla traders shouldn’t worry too much about the chart until after the deliveries number is announced. The stock may react strongly one way or another to the fundamental news. Once the initial rise or fall is over, however, it’s probably a good idea to check several levels on the chart to see if the technical picture has changed.
If the delivery number is bullish, watch the $290 level. A breakout above the 50-day SMA at $292 and above the March peak at $295 could be a sign the stock is headed back to $380 in the longer term.
If the delivery number triggers a sell-off, the $245 level will be critical. If long-term support at $245 is broken, Tesla may not find its next support level until the $175 to $185 range that held up the stock back in late 2016.
Tesla traded around $286.30 per share at time of publication Tuesday afternoon.
Related Links:
JPMorgan Cuts Tesla Price Target After Meeting With Management
A Pair Of Analysts Cut Tesla Price Targets Ahead Of Q1 Deliveries
© 2025 Benzinga.com. Benzinga does not provide investment advice. All rights reserved.
Trade confidently with insights and alerts from analyst ratings, free reports and breaking news that affects the stocks you care about.

