In last month's post titled RIMM Options on Sale? we made the case for a potential low in implied volatility for the crack berry maker. Though I'd like to attribute the call to my cunning intellect, there may have been a dash of luck involved. The recent tone of the market has certainly helped as its been a rising volatility tide lifting all boats. The original RIMM analysis relied on the cycle of implied volatility as well as HV-IV analysis, two methods of volatility forecast. For those interested in learning more of volatility charts, I suggest reviewing the original commentary regarding RIMM's setup. The following chart displays the timing of the initial post and subsequent volatility rise.
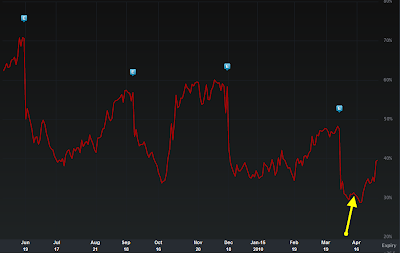 [Source: Livevol Pro]
In an attempt to exploit the expected rise in volatility, suppose on April 14th with RIMM trading at $73 you decided to enter a May 70-75 strangle for $3.50. Though you virtually nailed the bottom in volatility, had you simply sat on the trade and done nothing since inception you would have very little gain to speak of. Though volatility has experienced a nice ramp up, you've been fighting time decay the entire time and have failed to see much of an extended move in one direction or the other in RIMM's stock price. But alas, such is the nature of a long strangle. Though straddles and strangles are touted as bi-directional trades, truth is you really need a large move in one direction to start raking in the dough. Any type of back and forth churn (like RIMM over the past few weeks) can cause losses due to time decay start to mount.
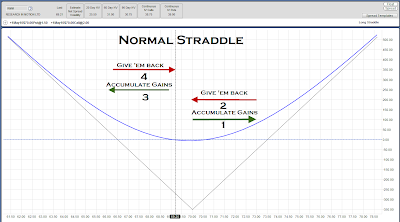
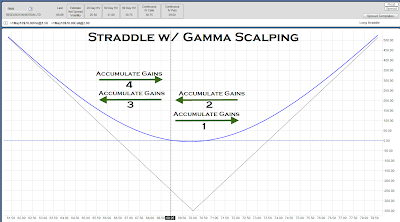
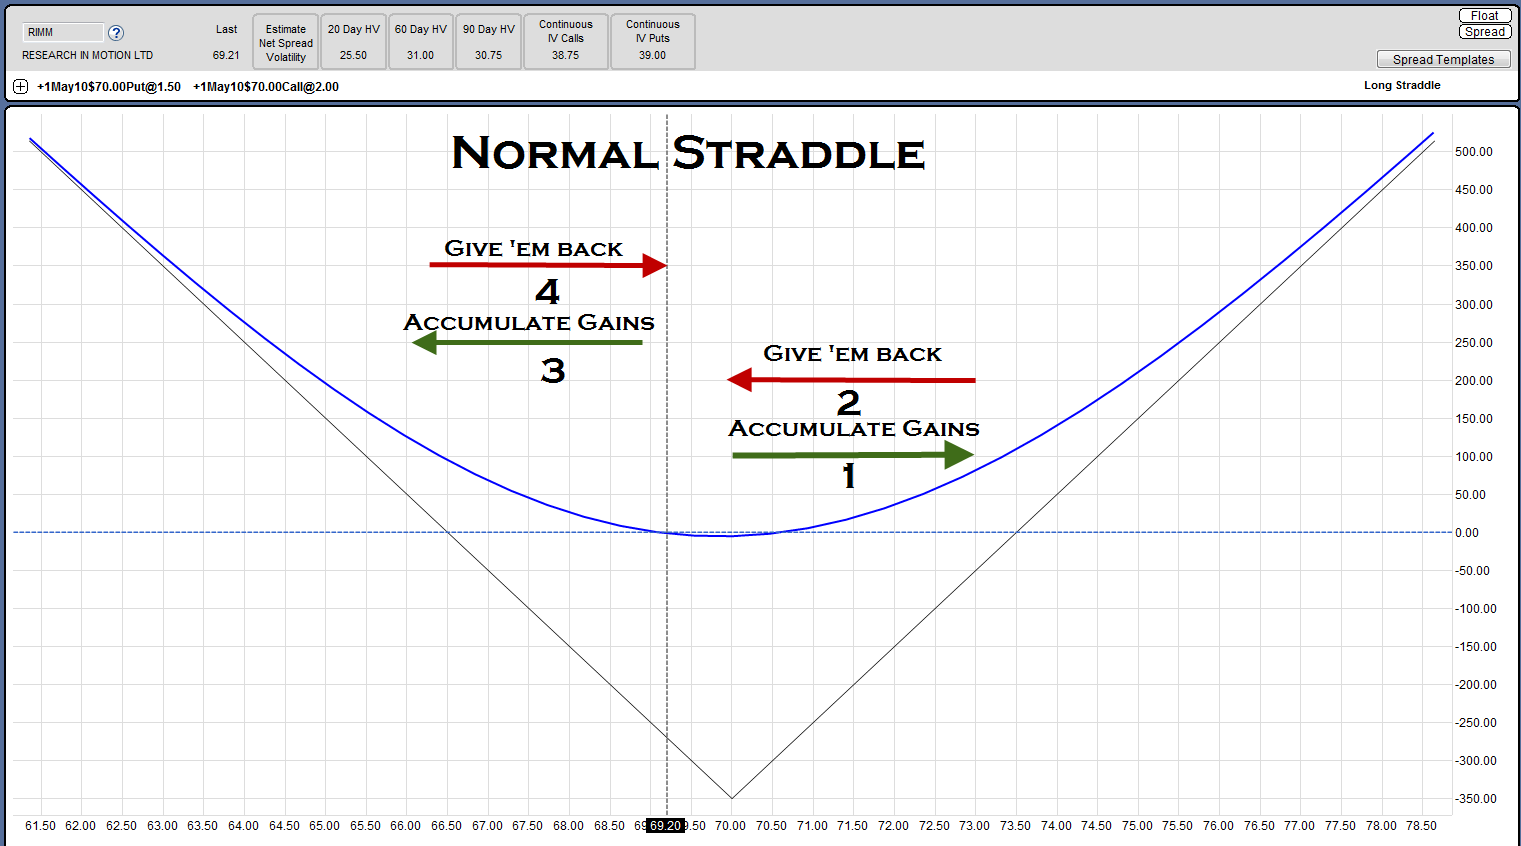
But is there a silver lining to back and forth churn? Might there be some way to take advantage of these back and forth swings? The answer lies with gamma scalping. The nature of a positive gamma trade, such as straddles/strangles, is to get you longer into rallies and shorter into dips. It is possible to use stock to lock in short term unrealized gains on a strangle trade. This can be accomplished by shorting stock into rallies and buying stock into dips. From a delta perspective, we're using stock to re-neutralize our option's position. From a risk graph perspective, we're using stock to re-center the graph. Consider the 70 straddle risk graph displayed below (click image to enlarge):
 [Source: MachTrader]
Suppose after entering the trade RIMM proceeded to rally from $70 to $73, drop back to $70, drop to $66, and finally rally back to $70. Though we're seeing a decent amount of volatility, by reverting back to $70, the straddle keeps giving back its gains. Had we taken the gamma scalping route by shorting shares of stock near $73, and buying stock towards $70 or $66 the outcome could have been drastically different.
 Gamma scalping successfully requires actively monitoring your position and dealing with the perpetual dilemma of timing your adjustments which is often times easier said than done. It can serve as a powerful weapon in combating the back and forth churn that often frustrates straddle buyers.
Market News and Data brought to you by Benzinga APIs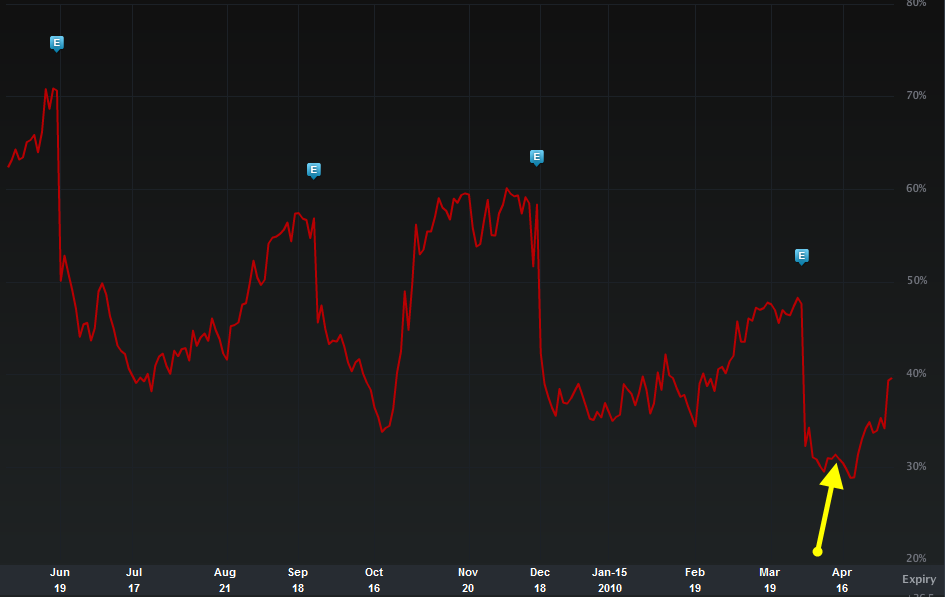 [Source: Livevol Pro]
In an attempt to exploit the expected rise in volatility, suppose on April 14th with RIMM trading at $73 you decided to enter a May 70-75 strangle for $3.50. Though you virtually nailed the bottom in volatility, had you simply sat on the trade and done nothing since inception you would have very little gain to speak of. Though volatility has experienced a nice ramp up, you've been fighting time decay the entire time and have failed to see much of an extended move in one direction or the other in RIMM's stock price. But alas, such is the nature of a long strangle. Though straddles and strangles are touted as bi-directional trades, truth is you really need a large move in one direction to start raking in the dough. Any type of back and forth churn (like RIMM over the past few weeks) can cause losses due to time decay start to mount.
But is there a silver lining to back and forth churn? Might there be some way to take advantage of these back and forth swings? The answer lies with gamma scalping. The nature of a positive gamma trade, such as straddles/strangles, is to get you longer into rallies and shorter into dips. It is possible to use stock to lock in short term unrealized gains on a strangle trade. This can be accomplished by shorting stock into rallies and buying stock into dips. From a delta perspective, we're using stock to re-neutralize our option's position. From a risk graph perspective, we're using stock to re-center the graph. Consider the 70 straddle risk graph displayed below (click image to enlarge):
 [Source: MachTrader]
Suppose after entering the trade RIMM proceeded to rally from $70 to $73, drop back to $70, drop to $66, and finally rally back to $70. Though we're seeing a decent amount of volatility, by reverting back to $70, the straddle keeps giving back its gains. Had we taken the gamma scalping route by shorting shares of stock near $73, and buying stock towards $70 or $66 the outcome could have been drastically different.
 Gamma scalping successfully requires actively monitoring your position and dealing with the perpetual dilemma of timing your adjustments which is often times easier said than done. It can serve as a powerful weapon in combating the back and forth churn that often frustrates straddle buyers.
© 2025 Benzinga.com. Benzinga does not provide investment advice. All rights reserved.
Benzinga simplifies the market for smarter investing
Trade confidently with insights and alerts from analyst ratings, free reports and breaking news that affects the stocks you care about.
Join Now: Free!
Already a member?Sign in

