
There is a consistent mix of global (including U.S.) to international (ex-U.S.) ETFs to consider. Beyond this, most ETFs in this sector have similar characteristics and results. Some may be skewed given exposure to areas with better recent performance (U.S. inclusive) than others (eurozone). Since global central banks, especially those in developed countries, have adopted an ultra-low interest rate policies, trend correlations among global have been very high. It’s only a difference in degree where variations are noticeable.
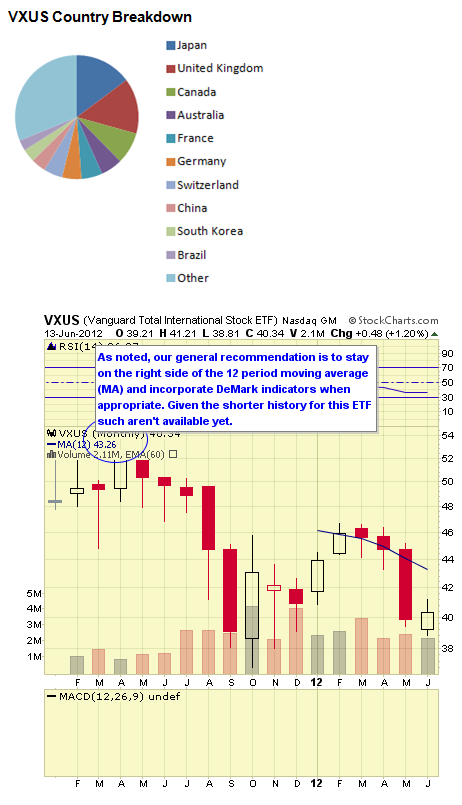
We feature a technical view of conditions from monthly chart views. Simplistically, we recommend longer-term investors stay on the right side of the 12 month simple moving average. When prices are above the moving average, stay long, and when below remain in cash or short. Some more interested in a fundamental approach may not care so much about technical issues preferring instead to buy when prices are perceived as low and sell for other reasons when high; but, this is not our approach. Premium members to the ETF Digest receive added signals when markets become extended such as DeMark triggers to exit overbought/oversold conditions.
#10: Vanguard Total International Stock ETF (NYSE: VXUS) 
VXUS follows the MSCI All Country World ex-USA Investable Market Index which is MSCI’s way of saying all stocks outside the U.S. that they consider investable. (Silly mouthful isn’t it?) The fund was launched in January 2011. The expense ratio is 0.18%. In a short period of time since launch, AUM have jumped to $715M and average daily trading volume is 130K shares.
As of June 2012 the annual dividend yield was 3.24% and YTD return –0.59%. The one year return was -15.58%. VXUS trades commission free at Vanguard.
Data as of June 2012
VXUS Top Ten Holdings & Weightings
-
Nestle SA (NSRGF): 1.18% -
HSBC Holdings PLC (HBCYF): 0.90%
-
BP Plc (BPAQF): 0.80%
-
Vodafone Group PLC (VODPF): 0.79%
-
Novartis AG (NVSEF): 0.73%
-
Roche Holding AG (RHHVF): 0.69%
-
Toyota Motor Corporation (7203): 0.68%
-
BHP Billiton Limited (BHPLF): 0.66%
-
GlaxoSmithKline PLC (GLAXF): 0.64%
-
Total SA (FP): 0.61%
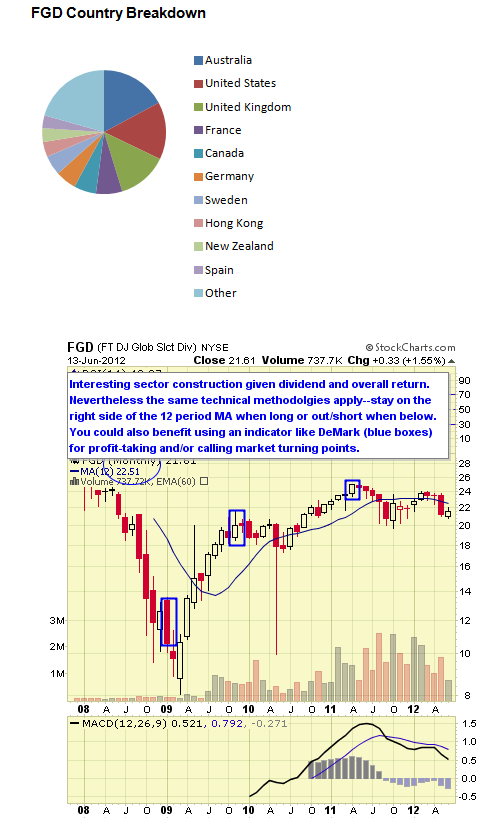
#9: First Trust DJ Global Dividend ETF FGD
FGD follows the Dow Jones Dividend Select Index which is an indicated annual dividend yield weighted index of 100 stocks selected from the developed market portion of the Dow Jones World Index, subject to certain buffers designed to limit turnover. The fund was launched in November 2007. The expense ratio is 0.60%.
AUM equal $167M and average daily trading volume is 63K shares. As of June 2012 the annual dividend yield was 5.05% and YTD return -0.23%. The one year return was -8.25%.
Data as of June 2012
FGD Top Ten Holdings & Weightings
-
Telecom Corporation of New Zealand Ltd (TEL): 2.52% -
RWE AG (RWE): 2.03%
-
Cable & Wireless Communications PLC (CWIXF): 1.78%
-
Shimao Property Holdings Ltd. H Shares (00813): 1.76%
-
Hays PLC (HAS): 1.75%
-
Peab AB (PEAB B): 1.68%
-
ProSiebenSat.1 Media AG (PSM): 1.68%
-
NCC AB (NCC B): 1.63%
-
Konecranes Oyj (KCR1V): 1.54%
-
Telstra Corp Ltd (TTRAF): 1.48%
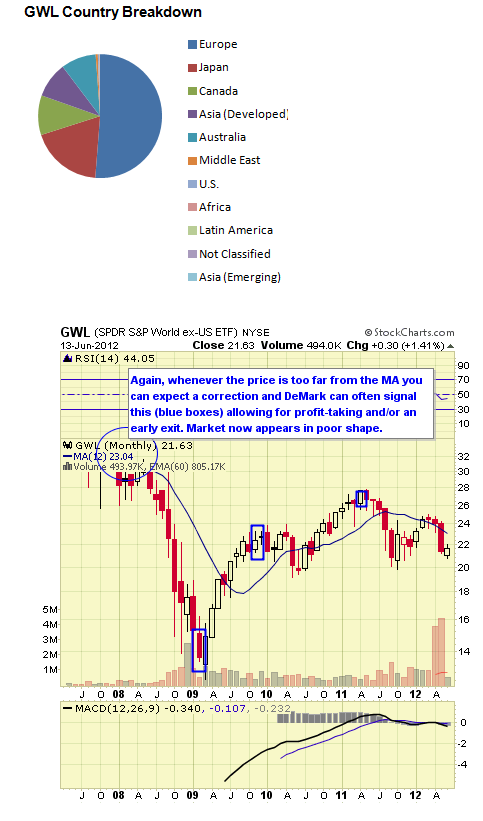
#8: SPDR World ex-U.S. ETF GWL
GWL follows the S&P Developed ex-U.S. BMI Index which is a market capitalization weighted index of stock within developed countries outside the U.S. The fund was launched in April 2007. The expense ratio is 0.34%. AUM equal $276M and average daily trading volume is 142K shares. As of June 2012 the annual dividend yield was 3.29% and YTD return -0.28%. The one year return was -15.06%.
Data as of June 2012
GWL Top Ten Holdings & Weightings
-
Samsung Electronics Co Ltd GDR (SSNHY): 2.55%
-
Nestle SA (NSRGF): 1.59%
-
Novartis AG (NVSEF): 1.15%
-
HSBC Holdings PLC (HBCYF): 1.14%
-
Vodafone Group PLC (VODPF): 1.08%
-
Royal Dutch Shell PLC (RYDAF): 1.00%
-
GlaxoSmithKline PLC (GLAXF): 1.00%
-
BP PLC (BPAQF): 1.00%
-
Roche Holding AG (RHHVF): 0.96%
-
BHP Billiton Ltd (BHPLF): 0.92%
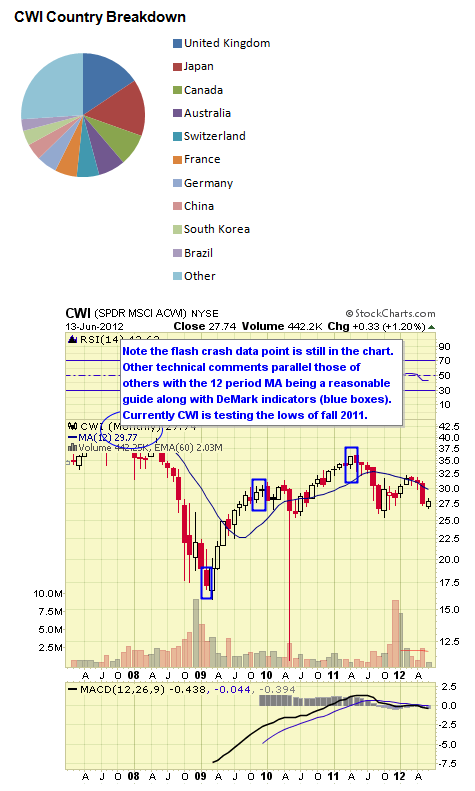
#7: SPDR All Country World ex-U.S. ETF CWI
CWI follows the MSCI All Country World ex-U.S. Index which is the proprietary MSCI index whose methodology remains undisclosed. The fund was launched in January 2007. The expense ratio is 0.34%. AUM equal nearly $384M and average daily trading volume is 65K shares.
As of June 2012 the annual dividend yield was 3.05% and YTD return -1.86%. The one year return was -15.70%.
Data as of June 2012
CWI Top Ten Holdings & Weightings
-
Nestle SA (NSRGF): 1.71%
-
Vodafone Group PLC (VODPF): 1.10%
-
HSBC Holdings PLC (HBCYF): 1.09%
-
Samsung Electronics Co Ltd GDR (SSNHY): 0.96%
-
GlaxoSmithKline PLC (GLAXF): 0.94%
-
Roche Holding AG (RHHVF): 0.93%
-
BHP Billiton Ltd (BHPLF): 0.91%
-
Novartis AG (NVSEF): 0.90%
-
BP PLC (BPAQF): 0.88%
-
Toyota Motor Corp (7203): 0.85%
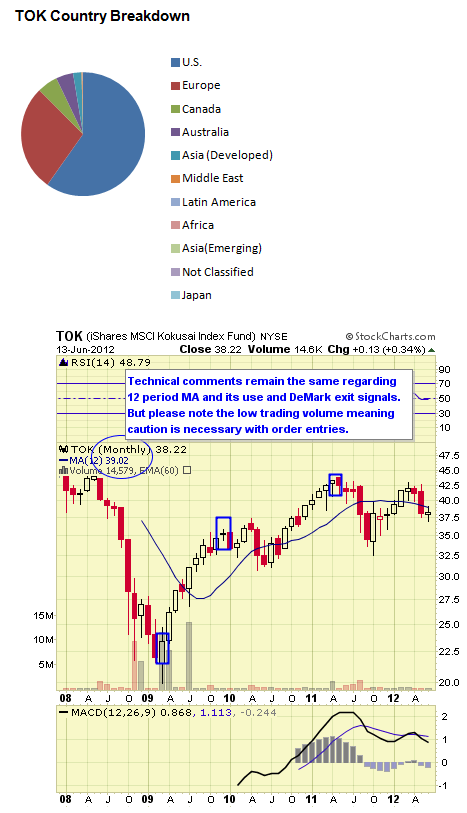
#6: iShares Kokusai ETF TOK
TOK follows the MSCI Kokusai Index which consists of countries with developed economies ex-Japan. The fund was launched in December 2010. The expense ratio is 0.25%. AUM equal $569M and average daily trading volume is a quite low 6K shares.
As of June 2012 the annual dividend yield was 2.52% and YTD return 2.06%. The one year return was -4.54%.
Data as of June 2012
TOK Top Ten Holdings & Weightings
-
Apple, Inc. (AAPL): 2.63%
-
Exxon Mobil Corporation (XOM): 1.85%
-
International Business Machines Corp (IBM): 1.11%
-
Microsoft Corporation (MSFT): 1.08%
-
AT&T Inc (T): 0.99%
-
General Electric Co (GE): 0.98%
-
Chevron Corp (CVX): 0.96%
-
Nestle SA (NSRGF): 0.92%
-
Procter & Gamble Co (PG): 0.84%
-
Johnson & Johnson (JNJ): 0.83%
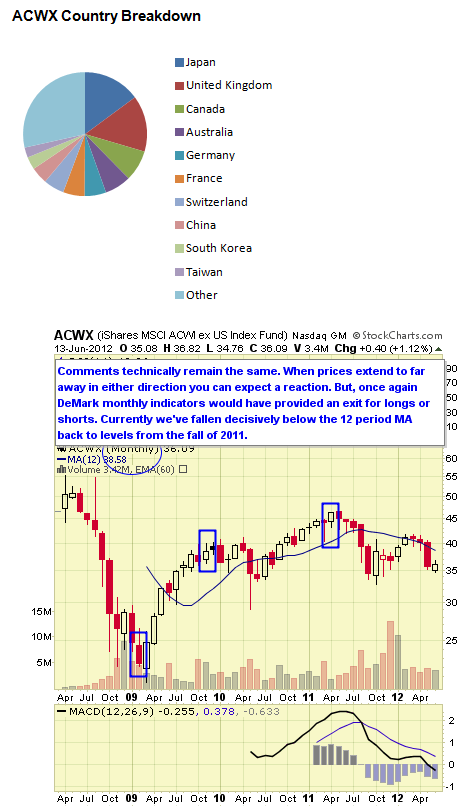
#5: iShares All Country ex-U.S. ETF ACWX 
ACWX follows the MSCI All Country World ex-U.S. Index which is another of MSCI’s proprietary indexes. The fund was launched in March 2008. The expense ratio is 0.35%. AUM equal $961 million and average daily trading volume is 367K shares. As of June 2012 the annual dividend yield was 3.14% and YTD return -1.25%. The one year return was -15.74%. ACWX trades commission free at Fidelity.
Note: Now you can start seeing a difference as ex-U.S. the holdings are much different and so too is the performance occasioned mostly by eurozone difficulties.
Data as of June 2012
ACWX Top Ten Holdings & Weightings
-
Nestle SA (NSRGF): 1.48%
-
HSBC Holdings PLC (HBCYF): 1.03%
-
Vodafone Group PLC (VODPF): 1.01%
-
Samsung Electronics Co Ltd (SSNLF): 0.93%
-
Novartis AG (NVSEF): 0.89%
-
GlaxoSmithKline PLC (GLAXF): 0.87%
-
Roche Holding AG (RHHVF): 0.83%
-
BP PLC (BPAQF): 0.83%
-
BHP Billiton Ltd (BHPLF): 0.83%
-
Toyota Motor Corp (7203): 0.82%
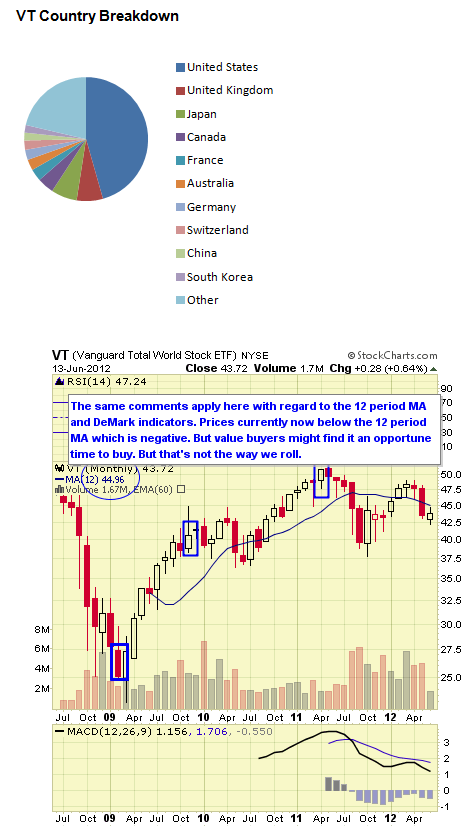
#4: Vanguard Total World Stock ETF VT
VT follows the FTSE All-World Index which consists of under 3 thousand stocks including both developed and emerging markets. The fund was launched in July 2008. The expense ratio is 0.22%. AUM equal $1.2B and average trading volume is 204K shares.
As of late June 2012 the annual dividend yield was 2.32% and YTD return 1.25%.The one year return was -8.97%. VT trades commission free at TD Ameritrade and Vanguard.
Data as of June 2012
VT Top Ten Holdings & Weightings
-
Apple, Inc. (AAPL): 1.63%
-
Exxon Mobil Corporation (XOM): 1.19%
-
Microsoft Corporation (MSFT): 0.79%
-
International Business Machines Corp (IBM): 0.70%
-
General Electric Co (GE): 0.6%
-
Chevron Corp (CVX): 0.61%
-
Nestle SA (NSRGF): 0.61%
-
Wells Fargo & Co (WFC): 0.53%
-
AT&T Inc (T): 0.52%
-
Procter & Gamble Co (PG): 0.52%
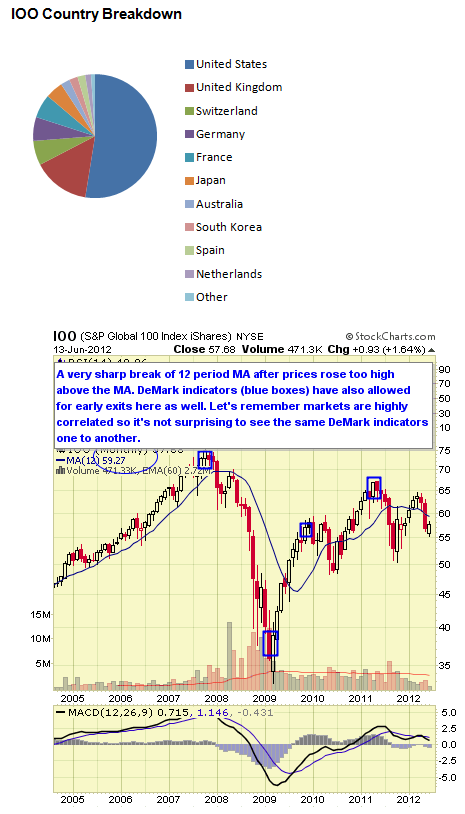
#3: iShares Global 100 ETF IOO
IOO follows the S&P Global 100 Index which measures the performance of 100 large transnational companies in the global market. The fund was launched in December 2000. The expense ratio is 0.40%. AUM equal $1billion and average daily trading volume is 62K shares. As of June 2012 the annual dividend yield was 3.10% and YTD return -0.45%.
The one year return was -8.23%. IOO trades commission free at TD Ameritrade.
Data as of June 2012
IOO Top Ten Holdings & Weightings
-
Exxon Mobil Corporation (XOM): 5.52%
-
International Business Machines Corp (IBM): 3.32%
-
Microsoft Corporation (MSFT): 3.24%
-
General Electric Co (GE): 3.00%
-
Chevron Corp (CVX): 2.89%
-
Nestle SA (NSRGF): 2.78%
-
Procter & Gamble Co (PG): 2.57%
-
Johnson & Johnson (JNJ): 2.56%
-
Coca-Cola Co (KO): 2.52%
-
Pfizer Inc (PFE): 2.46%
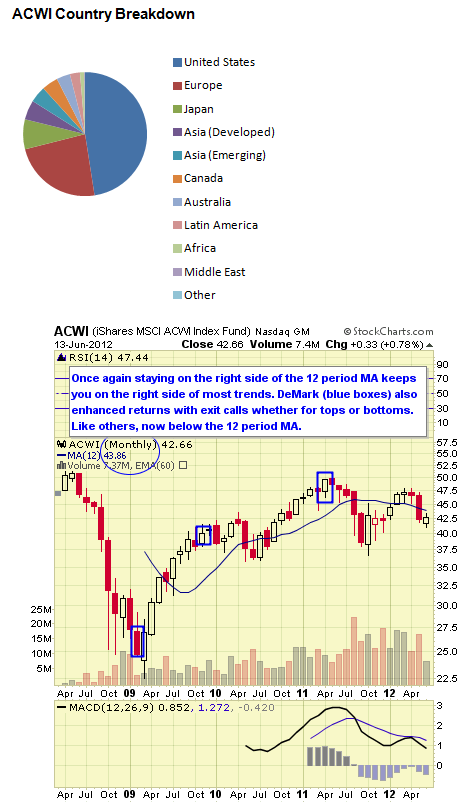
#2: iShares All Country ETF (ACWI)
ACWI follows the MSCI All Country World Index which is all the description MSCI wants you to know. The fund was launched in March 2008. T27he expense ratio is 0.35%. AUM equal $2.6B and average daily trading volume is over 780K shares. As of June 2012 the annual dividend yield was 2.36% and YTD return 1.16%.
The one year return was -8.72%. ACWI trades commission free at TD Ameritrade and Fidelity.
Data as of June 2012
ACWI Top Ten Holdings & Weightings
-
Apple, Inc. (AAPL): 2.05%
-
Exxon Mobil Corporation (XOM): 1.48%
-
International Business Machines Corp (IBM): 0.92%
-
Microsoft Corporation (MSFT): 0.85%
-
Nestle SA (NSRGF): 0.75%
-
AT&T Inc (T): 0.74%
-
General Electric Co (GE): 0.74%
-
Chevron Corp (CVX): 0.73%
-
Pfizer Inc (PFE): 0.67%
-
Philip Morris International, Inc. (PM): 0.63%
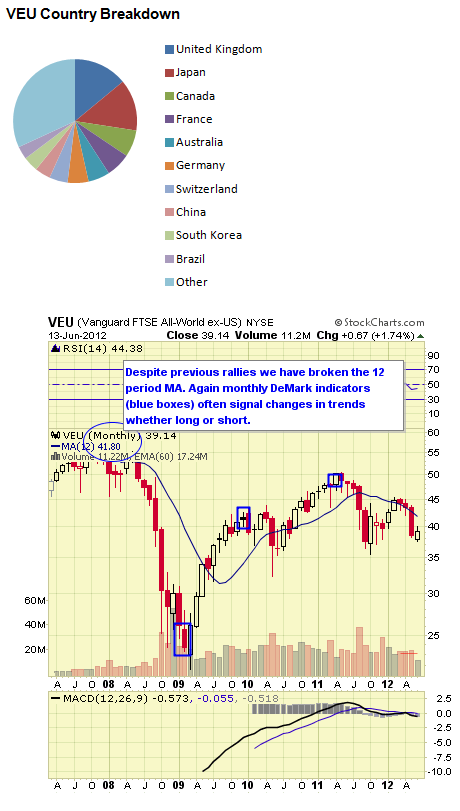
#1: Vanguard All-World ETF (VEU)
VEU follows the FTSE All-World ex-U.S. ETF) follows the FTSE All-World ex-U.S. Index which includes 2000 stocks from 46 different countries. The fund was launched in March 2007. The expense ratio is 0.18%. AUM equal $6.3B and average daily trading volume is 919K shares. As of June 2012 the annual dividend yield was 3.49% and YTD return -1.29%.
The one year return was -17.25%. VEU trades commission free at TD Ameritrade and Vanguard.
Data as of June 2012
VEU Top Ten Holdings & Weightings
-
Nestle SA (NSRGF): 1.31%
-
HSBC Holdings PLC (HBCYF): 0.95%
-
BP Plc (BPAQF): 0.84%
-
Novartis AG (NVSEF): 0.83%
-
Vodafone Group PLC (VODPF): 0.83%
-
Royal Dutch Shell PLC (RYDAF): 0.77%
-
Roche Holding AG (RHHVF): 0.73%
-
BHP Billiton Limited (BHPLF): 0.69%
-
Total SA (FP): 0.69%
-
GlaxoSmithKline PLC (GLAXF): 0.68%
We rank the top 10 ETF by our proprietary stars system as outlined below. However, given that we’re sorting these by both short and intermediate issues we have split the rankings as we move from one classification to another.

Strong established linked index
Excellent consistent performance and index tracking
Low fee structure
Strong portfolio suitability
Excellent liquidity
![]()
Established linked index even if “enhanced”
Good performance or more volatile if “enhanced” index
Average to higher fee structure
Good portfolio suitability or more active management if “enhanced” index
Decent liquidity
![]()
Enhanced or seasoned index
Less consistent performance and more volatile
Fees higher than average
Portfolio suitability would need more active trading
Average to below average liquidity
![]()
Index is new
Issue is new and needs seasoning
Fees are high
Portfolio suitability also needs seasoning
Liquidity below average
It’s been a constant theme for the past few years to add global/international issues to your equity investment portfolio. There are times this is an advantage and sometimes not. This is why technical indicators such as we’ve pointed-out have been helpful in avoiding dangerous conditions or just maximizing returns. Over the past few years trend correlation among global markets has been quite high making for beta (volatility) differences only.
It’s also important to remember that ETF sponsors have their own competitive business interests when issuing products which may not necessarily align with your investment needs. New ETFs from highly regarded and substantial new providers are also being issued. These may include Charles Schwab’s ETFs and Scottrade’s Focus Shares which both are issuing new ETFs with low expense ratios and commission free trading at their respective firms. These may also become popular as they become seasoned.
For further information about portfolio structures using technical indicators like DeMark and other indicators, take a free 14-day trial at ETF Digest. Follow us on Twitter and Facebook as well and join our group conversations.
For further information about portfolio structures using technical indicators like DeMark and other indicators see www.etfdigest.com. You may follow us on Facebook as well and join our group conversations.
You may address any feedback to: feedback@etfdigest.com
The ETF Digest is long VT in one lazy hedged portfolio.
(Source for data is from ETF sponsors and various ETF data providers.)
© 2025 Benzinga.com. Benzinga does not provide investment advice. All rights reserved.
Trade confidently with insights and alerts from analyst ratings, free reports and breaking news that affects the stocks you care about.

