The Utilities sector ranks eighth out of the ten sectors as detailed in my sector roadmap. It gets my Dangerous rating, which is based on aggregation of ratings of 9 ETFs and 33 mutual funds in the Utilities sector as of July 13, 2012. Reports on the best & worst ETFs and mutual funds in every sector and style are here.
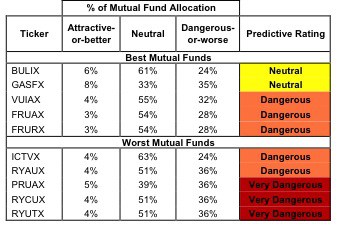
Figure 1 ranks from best to worst the eight Utilities ETFs that meet our liquidity standards and Figure 2 shows the five best and worst-rated Utilities mutual funds. Not all Utilities sector ETFs and mutual funds are created the same. The number of holdings varies widely (from 22 to 83), which creates drastically different investment implications and ratings. The best ETFs and mutual funds allocate more value to Attractive-or-better-rated stocks than the worst ETFs and mutual funds, which allocate too much value to Neutral-or-worse-rated stocks.
To identify the best and avoid the worst ETFs and mutual funds within the Utilities sector, investors need a predictive rating based on (1) stocks ratings of the holdings and (2) the all-in expenses of each ETF and mutual fund. Investors need not rely on backward-looking ratings. My fund rating methodology is detailed here.
Investors should not buy any Utilities ETFs or mutual funds because none get an Attractive-or-better rating. If you must have exposure to this sector, you should buy a basket of Attractive-or-better rated stocks and avoid paying undeserved fund fees. Active management has a long history of not paying off. Review my free stock screener to identify Attractive stocks in the Utilities sector.
See ratings and reports on all ETFs and mutual funds in this sector on my free mutual fund and ETF screener.
Figure 1: ETFs with the Best & Worst Ratings – Top 5 (where available)
* Best ETFs exclude ETFs with TNA’s less than 100 million for inadequate liquidity.
Sources: New Constructs, LLC and company filings
Focus Morningstar Utilities Index ETF FUI is excluded from Figure 1 because its total net assets (TNA) are below $100 million and do not meet our liquidity standards.
Figure 2: Mutual Funds with the Best & Worst Ratings – Top 5
* Best mutual funds exclude funds with TNA’s less than 100 million for inadequate liquidity.
Sources: New Constructs, LLC and company filings
Utilities Select Sector SPDR XLU is my top-rated Utilities ETF and American Century Quantitative Equity Funds, Inc: Utilities Fund BULIX is my top-rated Utilities mutual fund. Both earn my Neutral-or-worse rating and are not worth buying.
First Trust Utilities AlphaDEX Fund FXU is my worst-rated Utilities ETF and Rydex Series Funds: Utilities Fund RYUTX is my worst-rated Utilities mutual fund. Both earn a Very Dangerous rating and should be avoided.
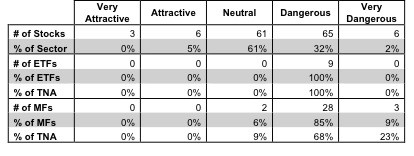
Figure 3 shows the disappointing truth that only 9 out of the 141 stocks (5% of the total net assets) held by Utilities ETFs and mutual funds get an Attractive-or-better rating. There are not many good stocks in the sector, which is why none of the 9 ETFs and 33 mutual funds are worth buying.
The takeaway is: quality stocks are required to create investment-worthy ETFs and mutual funds.
Figure 3: Utilities Sector Landscape For ETFs, Mutual Funds & Stocks
Sources: New Constructs, LLC and company filings
As detailed in “Cheap Funds Dupe Investors”, the fund industry offers many cheap funds but very few funds with high-quality stocks, or with what I call good portfolio management.
Investors should avoid all ETFs and mutual funds in the Utilities sector. No ETFs and only 2 mutual funds earn a Neutral rating and are worth holding if already owned. All other ETFs and mutual funds should be sold. Investors requiring exposure to the Utilities sector are better off focusing on individual stocks.
For example, Public Service Electric & Gas Company PEG is one of my favorite stocks held by Utilities ETFs and mutual funds and earns my Attractive rating. PEG is a rarity in the Utilities sector – a business with positive economic earnings and a cheap valuation. PEG has generated a return on invested capital (ROIC) above its weighted average cost of capital (WACC) in four of the last five years. Its current stock price (~$32.26) implies the company’s after-tax profits (NOPAT) will permanently decline by 40%. The market is setting a low bar, and PEG has demonstrated that it can grow NOPAT.
IDACORP Inc. IDA is one of my least favorite stocks held by Utilities ETFs and mutual funds and earns my Very Dangerous rating. IDA is a value destroyer with an expensive valuation and is a prime example of why I’m bearish on the Utilities sector. The company has generated negative economic earnings every year since 1998, when my model starts. To justify its current stock price (~$42.93), IDA must increase profits by 7.2% compounded annually for the next 19 years. Growth like this is unlikely given a mature market and the regulation faced by all Utilities.
91 stocks of the 3000+ I cover are classified as Utilities stocks, but due to style drift, Utilities ETFs and mutual funds hold 141 stocks.
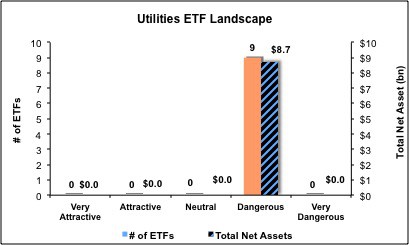
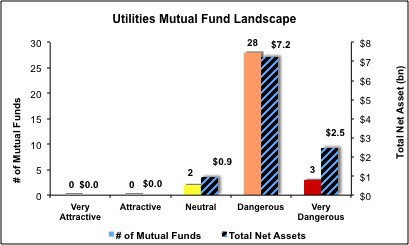
Figures 4 and 5 show the rating landscape of all Utilities ETFs and mutual funds.
Our sector roadmap report ranks all sectors and highlights those that offer the best investments.
Figure 4: Separating the Best ETFs From the Worst ETFs
Figure 5: Separating the Best Mutual Funds From the Worst Mutual Funds
Review my full list of ratings and rankings along with free reports on all 9 ETFs and 33 mutual funds in the Utilities sector.
isclosure: I receive no compensation to write about any specific stock, sector or theme.
© 2025 Benzinga.com. Benzinga does not provide investment advice. All rights reserved.
Trade confidently with insights and alerts from analyst ratings, free reports and breaking news that affects the stocks you care about.


