


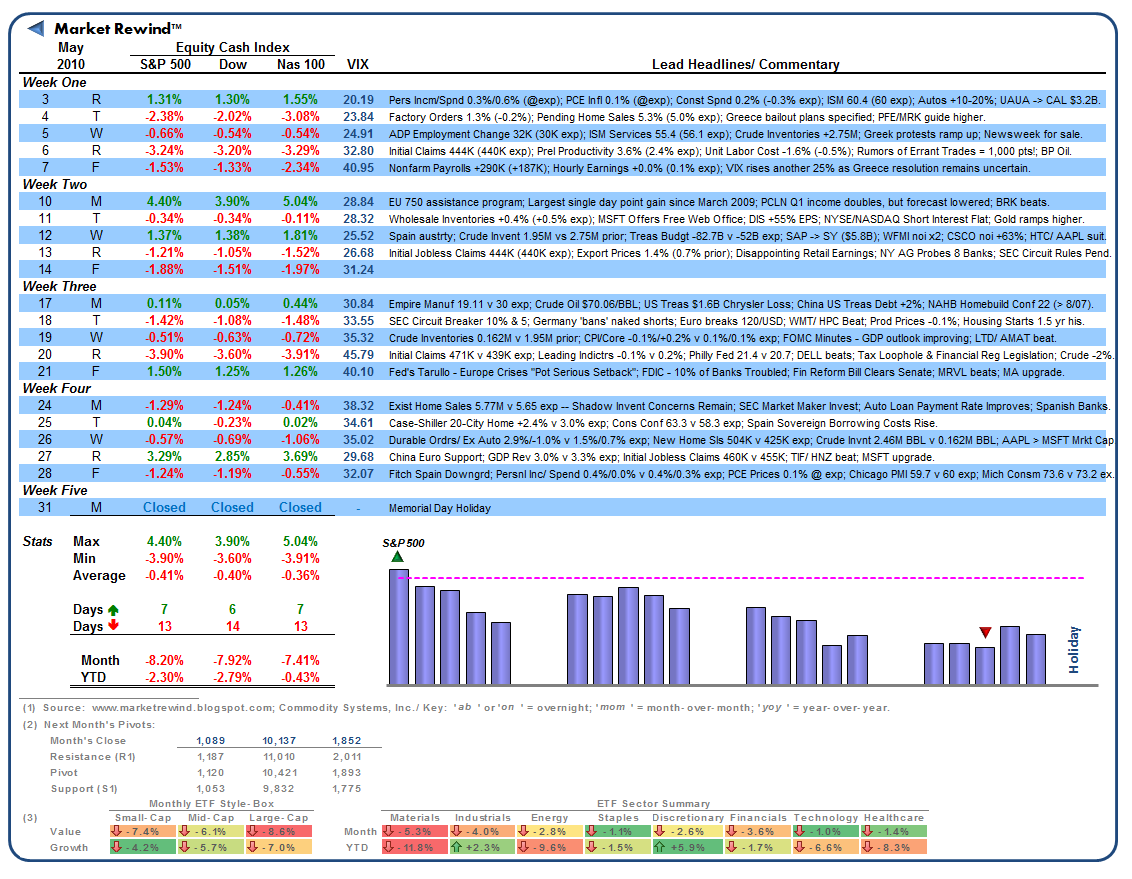
 After a rocky April, May was a veritable cascade reminiscent of Fall 2008, featuring an all-in retrace now well past a 10% "official" correction here at the mid-month on sovereign debt contagion and building double-dip worries.
The S&P 500, Dow Jones Industrials and NASDAQ 100 cash indices all finished lower for the month by -8.20%, -7.92%, -7.41% respectively for negative annual readings across the board. With many major indices now just under their respective 200-day moving averages and volatility still fairly high and erratic, it feels as if the markets could run hard either direction at any moment.
Sentiment: Negative
Volatility: Moderate to High (VIX 20-46)
Direction: Highly Negative
[Click to Enlarge/ Weekly ETF Analyses/ Prior Monthly Summaries/ Mrkt Rotation Selections]
The Style-Box was calculated using the following PowerShares™ ETFs: Small-Growth (PWT), Small-Value (PWY), Mid-Growth (PWJ), Mid-Value (PWP), Large-Growth (PWB), and Large-Value (PWV). The Sector-Ribbon was calculated using the following Select Sector SPDR™ ETFs: Materials (XLB), Industrials (XLI), Energy (XLE), Staples (XLP), Discretionary (XLY), Financials (XLF), Technology (XLK), and Healthcare (XLV). The Standard & Poors 500, Dow Jones Industrial Average and NASDAQ 100 may be traded through ETF proxies, including the SPY or IVV, DIA and QQQQ, respectively.
PWPPerella Weinberg Partners
$23.00-2.73%
PWVInvesco Large Cap Value ETF
$59.73-0.63%
XLBMaterials Select Sector SPDR
$88.55-0.80%
XLESPDR Select Sector Fund - Energy Select Sector
$90.55-0.76%
XLFSPDR Select Sector Fund - Financial
$51.17-0.72%
XLISPDR Select Sector Fund - Industrial
$137.45-0.84%
XLKSPDR Select Sector Fund - Technology
$234.60-0.73%
XLPSPDR Select Sector Fund - Consumer Staples
$80.38-0.29%
XLVSPDR Select Sector Fund - Health Care
$146.03-%
XLYSPDR Select Sector Fund - Consumer Discretionary
$223.53-0.11%
© 2025 Benzinga.com. Benzinga does not provide investment advice. All rights reserved.
Benzinga simplifies the market for smarter investing
Trade confidently with insights and alerts from analyst ratings, free reports and breaking news that affects the stocks you care about.
Join Now: Free!
Already a member?Sign in

