The CBOE’s Volatility Index (VIX) rallied over 50 percent in January, suggesting that we may see further market volatility in the month of February. At the time of this writing on Monday, Dow futures have fallen by over 300 points from the highs of the day.
The VIX was created in 1993 as a means of tracking stock market volatility. The index mirrors the market's expectation of 30 day S&P 500 volatility, based on the prices of S&P 500 index options. The price of the VIX typically moves inversely to the S&P 500. The index rises as fear and uncertainty in the market increases. Due to this the VIX is sometimes referred to as the ‘fear index’.
VIX ETFs and ETNs can be used to hedge stock market exposure or to speculate on a declining stock market. Let's now take a look at the leading exchange traded funds by and notes, measured by assets under management, to consider in a rising volatility market.
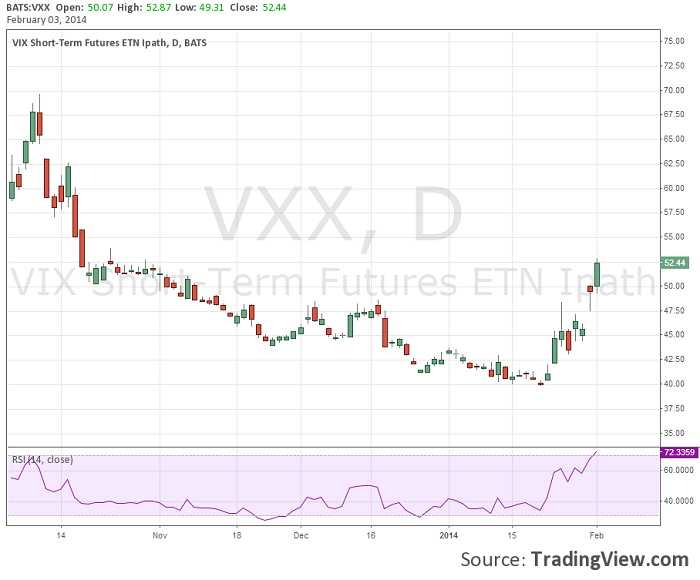
S&P 500 VIX Short-Term Futures ETN (VXX)
The S&P 500 VIX Short-Term Futures Exchange Traded Note is by far the largest by assets under management and also the most actively traded. The fund was launched in 2009 and is managed by Barclays iPath. VXX has assets under management of over $1 billion and an expense ratio of 0.89 percent. The expense ratio is the yearly management fee paid to the fund.
VIX Short-Term Futures ETF (VIXY)
Launched in 2011 by ProShares, VIXY has assets under management of over $278 million and an expense ratio of 0.85 percent. ProShares is part of ProFunds Group, the world's largest manager of short and leveraged funds. This ETF is based on a variety of VIX futures and aims to track changes in the expectation for the VIX over a specific timeframe.
ProShares Ultra VIX Short-Term Futures ETF (UVXY)
Also Issued by ProShares, this fund was launched in 2011, has assets under management of $220 million and an expense ratio of 0.95%. This fund is leveraged 200 percent, meaning that it seeks a return that is twice that of the underlying index for a single day, as measured by one Net Asset Value (NAV) calculation to the next.
In part due to the high expense ratios, these ETFs and ETNs are usually seen as a vehicle to hedge against risk in the short term, or to speculate in the short term, rather than long term investments.
VXX Daily Chart
Looking at the VXX daily chart we can see that price has rallied substantially after bottoming in January.
© 2025 Benzinga.com. Benzinga does not provide investment advice. All rights reserved.
Trade confidently with insights and alerts from analyst ratings, free reports and breaking news that affects the stocks you care about.

