


Year 4, Week 5 Major Position Changes
To see historic weekly fund changes click here OR the label at the bottom of this entry entitled 'fund positions'.
Cash: 71.4% (v 71.0% last week)
24 long bias: 28.3% (v 20.7% last week)
2 short bias: 0.3% (v 8.3% last week)
26 positions (vs 25 last week)
Weekly thought
A tale of two halves last week, with continued selloffs earlier in the week testing pivotal support, and an enormous mid week rally based on what one would consider degrading economic data... just not as bad as expected. S&P 1040 was hit 3 times in a 5 day span and rather than breaking, a Chinese PMI report (just barely expansionary but above the whisper thought that it might be contractionary) set off a wild display in S&P futures leading to a big up open Wednesday. The domestic ISM manufacturing report at 10 AM that day led to a 2nd leg higher as it was far in excess of expectation. But taking a step back, the body of work in economic reports was actually quite poor ... the only real positive outliers were ISM manufacturing and pending home sales. Another 6-8 reports were either "in line" or misses... but it shows you how the market is all about expectations in the near term - the mood had turned dour and after 2 months of miss after miss after miss in economic data, "in line" was good enough.
Bigger picture we are going nowhere fast.. the S&P 500 is just points away from where it began the year. This is not a buy and hold market; it's a traders market and has been all year. Nearer term we are in the 5th month of a wide range that mostly has centered in the S&P 1040 to 1130 area. Those, like myself, who like to buy breakdowns or breakouts out of a range have been stymied of late - whereas those who are content to trade a range and not worry about the market falling out of a range and causing losses (or missing out on gains) have prospered by buying at the edge of this range. Hence, U.S. markets are range bound and until the pattern is broken, traders will continue to play this 90 S&P point area.

All resistance levels were busted last week; much of it in premarket: 1040, 1057, 1070, and the 50 day simple moving average of 1085ish. The gap up on "awesome" employment data took the S&P 500 through the 200 day exponential moving average but unfortunately there is now a gap at S&P 1090 that will eventually need to be filled. In 3 short days 2/3rds of the 90 point range was covered and just like that we've moved from oversold to (soon) overbought.
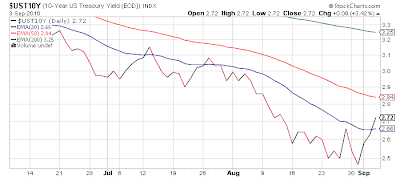
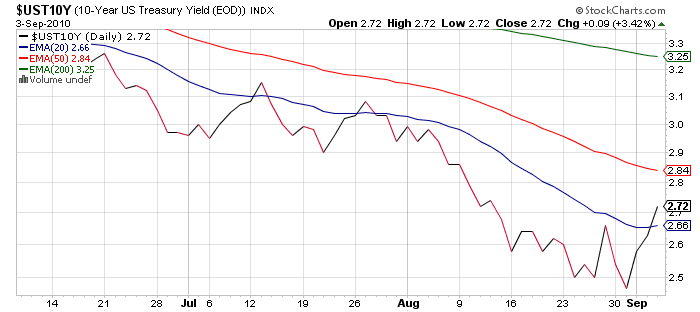
Last week, the 10 year bond finally relented and is in process of filling a gap. Using the very popular iShares Barclays 20+ Year Treasury Bond (TLT) this is represented by the 'breakout' level of $102.

Generally one can make excellent money when a breakout returns to its base so this will be an area to target... further, in an incredibly correlated market any move to the top of the S&P range (nearer to 1130) would coincide with this bond instrument pulling back. Looking at yields this would probably mirror a move to 2.80%ish on the 10 year.
And that's about it for analysis on the market nowadays... it is either risk on or off, and every 2nd or 3rd day is now a 90% day where almost every stock (and commodity) on earth trades in the same direction as algorithms dominate in their EFT playground and fundamentals, or industry trends are a sideshow for dinosaurs of the 1990s. Not much different from the student body left environment we've been stuck in since 2007 - if anything it is getting worse. Knowing which way the S&P 500 is going to trade each day is 95% of the work - everything is becoming increasingly useless.
---------------------------------------
Unlike the last two weeks, and especially last week, the calendar is very light this week - almost nothing is market moving other than Beige Book and weekly jobless claims. And since we consider a +70K monthly jobs number (almost all of which birth death adjustment) a victory, unless weekly claims go over 500,000 we apparently are to be encouraged that claims are stuck at recessionary 450K+. With a lull in economic reports and earnings season not set to launch until early October, it should be a quiet week dominate by technicals.
Tuesday: N/A
Wednesday: Beige Book (2 PM), Consumer Credit (3 PM)
Thursday: Weekly Claims & International Trade (premarket)
Friday: Wholesale Trade (10 AM)
-----------------------------------------
Portfolio
I was caught a bit off guard last week as I thought the repeated tests of S&P 1040 would lead to a more normal outcome, that is a breakdown. Instead a lukewarm Chinese PMI figure overnight Tuesday set world markets ablaze (but not the Chinese market itself!), and the 1-2 combo with US Mfg ISM led to tremendous pain for bears. I also thought 'the generals' (stocks with the highest relative strength) would falter more before the index bounces, as they suffered very little during the August downdraft. Last week, I thought the Chinese PMI might contract and that US employment (private) might contract... hence I was cautious from that angle as well. While private ADP showed US employment was negative, with the benefit of the birth death model (a gauge of small business formation the government has been spinning the entire Great Recession as creating millions of jobs a year - even as banking data shows small business struggling) the 'official' number was positive. ISM Services, which is a much broader measure of the current U.S. economy was released Friday and was sharply down from July's levels - and well below consensus... but it was lost in the euphoria of the jobs report.
As the S&P 500 began to bounce I turned somewhat more long biased, but the move was so vicious and so much of it happened in premarket there is little time to play the bounce since our range is only 90 S&P points, and in 3 days over 60 points were gained on the bounce. While the general indexes are not overbought, many individual stocks went in 72 hours from lost at sea to extremely overbought gaining 15-20%+ in many cases... its student body left trading at its best. Risk on, risk off. Hence as we enter the new week, we already are less than 30 points away from the top end of the range and have a gap to fill at 1090. Therefore, I expect a lot more churn in a quiet week for news. What I decided to do was to take profits in those name that had moved tremendously in 3 sessions, and then add some newer names to the portfolio which had lagged, so if the rally continues they might offer some upside.
On the long side:
On the short side:


To see historic weekly fund changes click here OR the label at the bottom of this entry entitled 'fund positions'.
Cash: 71.4% (v 71.0% last week)
24 long bias: 28.3% (v 20.7% last week)
2 short bias: 0.3% (v 8.3% last week)
26 positions (vs 25 last week)
Weekly thought
A tale of two halves last week, with continued selloffs earlier in the week testing pivotal support, and an enormous mid week rally based on what one would consider degrading economic data... just not as bad as expected. S&P 1040 was hit 3 times in a 5 day span and rather than breaking, a Chinese PMI report (just barely expansionary but above the whisper thought that it might be contractionary) set off a wild display in S&P futures leading to a big up open Wednesday. The domestic ISM manufacturing report at 10 AM that day led to a 2nd leg higher as it was far in excess of expectation. But taking a step back, the body of work in economic reports was actually quite poor ... the only real positive outliers were ISM manufacturing and pending home sales. Another 6-8 reports were either "in line" or misses... but it shows you how the market is all about expectations in the near term - the mood had turned dour and after 2 months of miss after miss after miss in economic data, "in line" was good enough.
Bigger picture we are going nowhere fast.. the S&P 500 is just points away from where it began the year. This is not a buy and hold market; it's a traders market and has been all year. Nearer term we are in the 5th month of a wide range that mostly has centered in the S&P 1040 to 1130 area. Those, like myself, who like to buy breakdowns or breakouts out of a range have been stymied of late - whereas those who are content to trade a range and not worry about the market falling out of a range and causing losses (or missing out on gains) have prospered by buying at the edge of this range. Hence, U.S. markets are range bound and until the pattern is broken, traders will continue to play this 90 S&P point area.

All resistance levels were busted last week; much of it in premarket: 1040, 1057, 1070, and the 50 day simple moving average of 1085ish. The gap up on "awesome" employment data took the S&P 500 through the 200 day exponential moving average but unfortunately there is now a gap at S&P 1090 that will eventually need to be filled. In 3 short days 2/3rds of the 90 point range was covered and just like that we've moved from oversold to (soon) overbought.
Last week, the 10 year bond finally relented and is in process of filling a gap. Using the very popular iShares Barclays 20+ Year Treasury Bond (TLT) this is represented by the 'breakout' level of $102.

Generally one can make excellent money when a breakout returns to its base so this will be an area to target... further, in an incredibly correlated market any move to the top of the S&P range (nearer to 1130) would coincide with this bond instrument pulling back. Looking at yields this would probably mirror a move to 2.80%ish on the 10 year.
And that's about it for analysis on the market nowadays... it is either risk on or off, and every 2nd or 3rd day is now a 90% day where almost every stock (and commodity) on earth trades in the same direction as algorithms dominate in their EFT playground and fundamentals, or industry trends are a sideshow for dinosaurs of the 1990s. Not much different from the student body left environment we've been stuck in since 2007 - if anything it is getting worse. Knowing which way the S&P 500 is going to trade each day is 95% of the work - everything is becoming increasingly useless.
---------------------------------------
Unlike the last two weeks, and especially last week, the calendar is very light this week - almost nothing is market moving other than Beige Book and weekly jobless claims. And since we consider a +70K monthly jobs number (almost all of which birth death adjustment) a victory, unless weekly claims go over 500,000 we apparently are to be encouraged that claims are stuck at recessionary 450K+. With a lull in economic reports and earnings season not set to launch until early October, it should be a quiet week dominate by technicals.
Tuesday: N/A
Wednesday: Beige Book (2 PM), Consumer Credit (3 PM)
Thursday: Weekly Claims & International Trade (premarket)
Friday: Wholesale Trade (10 AM)
-----------------------------------------
Portfolio
I was caught a bit off guard last week as I thought the repeated tests of S&P 1040 would lead to a more normal outcome, that is a breakdown. Instead a lukewarm Chinese PMI figure overnight Tuesday set world markets ablaze (but not the Chinese market itself!), and the 1-2 combo with US Mfg ISM led to tremendous pain for bears. I also thought 'the generals' (stocks with the highest relative strength) would falter more before the index bounces, as they suffered very little during the August downdraft. Last week, I thought the Chinese PMI might contract and that US employment (private) might contract... hence I was cautious from that angle as well. While private ADP showed US employment was negative, with the benefit of the birth death model (a gauge of small business formation the government has been spinning the entire Great Recession as creating millions of jobs a year - even as banking data shows small business struggling) the 'official' number was positive. ISM Services, which is a much broader measure of the current U.S. economy was released Friday and was sharply down from July's levels - and well below consensus... but it was lost in the euphoria of the jobs report.
As the S&P 500 began to bounce I turned somewhat more long biased, but the move was so vicious and so much of it happened in premarket there is little time to play the bounce since our range is only 90 S&P points, and in 3 days over 60 points were gained on the bounce. While the general indexes are not overbought, many individual stocks went in 72 hours from lost at sea to extremely overbought gaining 15-20%+ in many cases... its student body left trading at its best. Risk on, risk off. Hence as we enter the new week, we already are less than 30 points away from the top end of the range and have a gap to fill at 1090. Therefore, I expect a lot more churn in a quiet week for news. What I decided to do was to take profits in those name that had moved tremendously in 3 sessions, and then add some newer names to the portfolio which had lagged, so if the rally continues they might offer some upside.
On the long side:
- With Riverbed Technology (RVBD) up 23% since I bought it on August 12th, I took another round of profits Tuesday.
- I closed the position in Monsanto (MON), as a narrowing of guidance, punished the stock and it broke support on the charts.
- Wednesday, when ISM Manufacturing came in better than expected I quickly bought a 3% allocation in SPY September 107 calls anticipating a positive reaction; in part this was to offset the losses in the SPY puts (1%) allocation I was holding. This happened around S&P 1070 and my target was S&P 1081 which was where the 50 day simple moving average had fallen to in the first half of the week. I sold this in 2 batches, first (same day) at 1078 and then Thursday morning around 1081.
- Thursday, I sold 30% of Amazon.com (AMZN), and half of Magna International (MGA) as both were stretching into overbought territory.
- Friday, I continued to sell things that were overbought - 50% of Netflix (NFLX), Acme Packet (APKT) and 40% of BorgWarner (BWA).
- I took some of the monies in names I had taken profits in and moved them into 3 new names that had lagged on the hopes if the market continues up these would 'catch up': Gafisa (GFA), Titanium Metals (TIE), and Power-One (PWER).
- I began a modest rebuild (1%) of F5 Networks (FFIV).
On the short side:
- As the S&P 500 tested 1040 for the 3rd time in 5 sessions, I opined (wrongly) that the more times you test a level the more you are likely to break it. Traditionally this is how it works out, but all that gives you is increased probability, not a crystal ball. I bought a 1% exposure of October 104 SPY puts as 'portfolio insurance Tuesday, thinking I'd hold it for 7 weeks in case 1040 broke. Instead I ended up selling them the next day as the viciousness of the rally meant these would lose a lot of money (in % terms) if the market kept going up.
- I covered a short in Burger King (BKC) for a quick 3.5% gain from an entry point late the previous week; this was a very lucky transaction as overnight Wednesday the stock was rumored as a PE takeover candidate, which was confirmed late in the week.
- A stop loss on the short of Toll Brothers (TOL) triggered at a 3% loss on the surge on ISM Manufacturing Wednesday.
- Friday's gap up on employment data finally triggered a stop loss in the short on Symantec (SYMC) at 3%.
AMZNAmazon.com Inc
$170.20-4.60%
Edge Rankings
Momentum62.00
Growth94.23
Quality71.41
Value49.36
Price Trend
Short
Medium
Long
© 2025 Benzinga.com. Benzinga does not provide investment advice. All rights reserved.
Posted In:
Benzinga simplifies the market for smarter investing
Trade confidently with insights and alerts from analyst ratings, free reports and breaking news that affects the stocks you care about.
Join Now: Free!
Already a member?Sign in

