
With the S&P 500 SPY having blasted up 10.9 percent in just 12 days, it is safe to say that the bulls have displayed a little "oomph" in their latest joyride to the upside.
To students of the game, it is the "oomph" behind the move that is really the key.
You see, the important question on everyone's minds after a move such as we've seen over that last couple weeks is: Can it continue?
The beauty of staying in tune with the trend of the market is that price cannot deviate from itself as a directional indicator. In other words, if one is long and price is moving higher, it is a good thing -- always. However, the fact that price is moving up does little to help one with the question of whether or not the move can continue.
Where's The Beef?
For help in this regard, one can turn to momentum indicators. Put simply, if the bulls are rallying with gusto, it is generally a good indication that the move has not yet run out of steam. However, if an uptrend is merely limping along, then the move tends to be susceptible to any number of negative inputs.
The uptrends that took place this summer were good examples of rallies that looked good from a price perspective but didn't have much in the way of "oomph" or momentum behind them.
S&P 500 - Daily
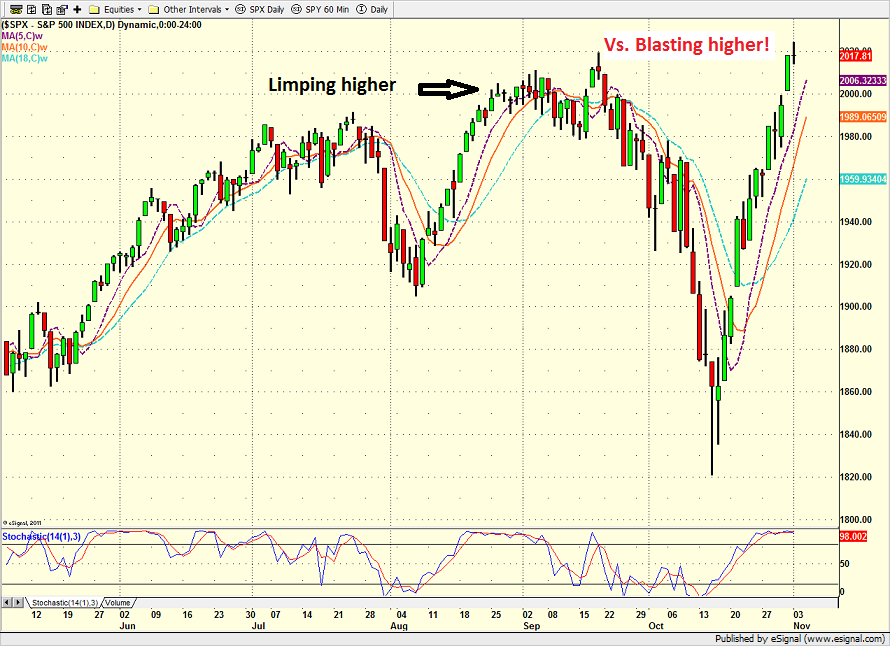
This Time There Is Some "Oomph"
Perhaps more important than the set of new all-time highs seen on the Dow, S&P and Nasdaq 100 is the fact that the momentum indicators have started to flash positive "thrust" signals. The bottom line here is that when momentum thrusts occur, the market has historically stayed in a positive mode for a decent chunk of time.
The Price Stampede Indicator
One such indicator is called a price stampede. The indicator is simple, yet effective. When the percentage of stocks above their respective 10-day moving averages exceeds 90, it is a good indication that the bulls are on the move. No, make that stampeding!
One month after a price stampede, the S&P 500 has been up 1.24 percent on average since late 1980 versus the average gain of 0.77 percent seen for all 21-day trading periods. Of the 28 occurrences since 10/10/1980, the S&P 500 was higher 61 percent of the time.
Three months later, the S&P 500 has gained 4.14 percent versus the 2.32 percent gain for all three-month periods -- and the trades were positive 70.3 percent of the time.
Six months later, the song remains the same as the S&P 500 was higher 81.5 percent of the time after the price stampede signal and sported an average gain of 9.22 percent -- compared to the average of all six-month periods of +4.75.
Even one year after a price stampede, the S&P 500 still outperforms all one-year periods 16.5 percent to 9.9 percent, with a winning percentage of 96.1 percent. The word you are probably looking for right now is, "impressive!"
So, given that for the last 35 years, the market has usually outperformed by a handsome margin after a price stampede, it is safe to say that the bulls have history on their side right now.
The good news is that the latest price stampede occurred on October 21, 2014.
But Should We Still Trust the Stampede?
The problem is that this signal, which once only fired every other year or so, now occurs with regularity. For example, over the last 35 years, there have been 28 price stampede buy signals. Ten of which occurred from 1980 through 2007, meaning that a price stampede occurred about once every 2.6 years on average. Therefore, this was once a VERY important buy signal to watch.
Since 2007 the character of the market has clearly changed. The elimination of the uptick rule for short-sales creates boatloads of buying when the shorts cover. The advent of broad based market ETFs where as many as 3,000 stocks can be traded with the click of a button has added tremendous upside movement to stocks. The invention of HFT designed to scalp fractions of a penny from trades and the ever-increasing use of high-speed algorithmic trading have clearly increased both the size and speed at which trends occur.
Because of this, there have been significantly more price stampede signals in the last seven years. While there were 10 buy signals in the 28 years between 1980 and 2007, there have been 18 price stampede signals since the beginning of 2008.
So instead of there being one price stampede every three years, there are now more than 2.5 per year on average. As such, the question begs to be asked: Does this indicator still work?
The Recent History
In looking at the price stampede signals since 2007, one finds that there were several very large moves -- in both directions after buy signals have occurred. The key here is to understand that during bear markets, the "dead cat bounces" almost always create momentum signals that wind up being quite negative one, three and six months out -- because the bears tend to quickly return after a brief blast higher.
However, if one removes the signals that occurred in 2008, the price stampede indicator produces returns that are similar to the historical averages over the next three and six-month periods as well as the 12-month periods. Therefore, it would appear that this indicator, while not as pound-the-table strong as it once was, is still worth paying attention to.
Since the market moves have been coming faster and harder in recent years, it is probably a good idea to utilize a protective stop strategy on any momentum-based buy signal one follows. The bottom line is that a price stampede can quickly turn on you if the computers start to sense bad news or a new crisis.
In conclusion, it would appear that the price stampede signal is either a harbinger of good things to come or merely a big move within an ugly market. Given that the S&P has just moved to a fresh all-time high, here's hoping it's the former.
Edge Rankings
Price Trend
© 2025 Benzinga.com. Benzinga does not provide investment advice. All rights reserved.
Trade confidently with insights and alerts from analyst ratings, free reports and breaking news that affects the stocks you care about.

