These graphs were produced by Capital Market Labs. Learn how the company is bringing the power of living data to the world of finance.
Although Plug Power Inc PLUG hit the scene in 2013 (sort of, it’s a 15 year old company) and rose from literally a penny stock to $12, reality has come crashing down on this company. The stock is down 25 percent in the last year, 44 percent in the last six months and 39 percent in the last three months.
Let’s turn to a number of charts that examine what exactly is going on (from a financial point of view).
Let’s start by plotting total revenue (TTM) in blue bars and net income (TTM) in the red line.

Plug is experiencing a recent boom in revenue (which is expected to continue), while net income has remained negative.
In a similar chart, let’s now replace cash from operations (TTM) as the red line and keep total revenue in the blue bars.

This trend is actually more disturbing, as net income can have a lot of “noise” in the numbers, but cash from operations is a clean look at the company’s operating performance.
The next chart compares Plug to its peers on earnings from continuing operation margin percentage (TTM).

Plug is by far the worst showing a -220 percent (that's negative) margin. The most obvious reason for the continued losses in cash from operations and net income is simply gross margin percentage.
Next, let's compare Plug to its peers in North America, with gross margin percentage on the y-axis and market cap on the x-axis.

Plug is the only one of its peers with negative gross margins.
When a company sells a product for more than it costs to produce, losses are a tautology. The hope for Plug is economies of scale, and that argument is not without merit, but it puts huge emphasis on the company’s ability to grow quickly.
For the record, Plug turned to positive gross margins two quarters ago, which was a huge accomplishment for the firm, but it turned negative again last quarter -- that is disastrous if it continues.
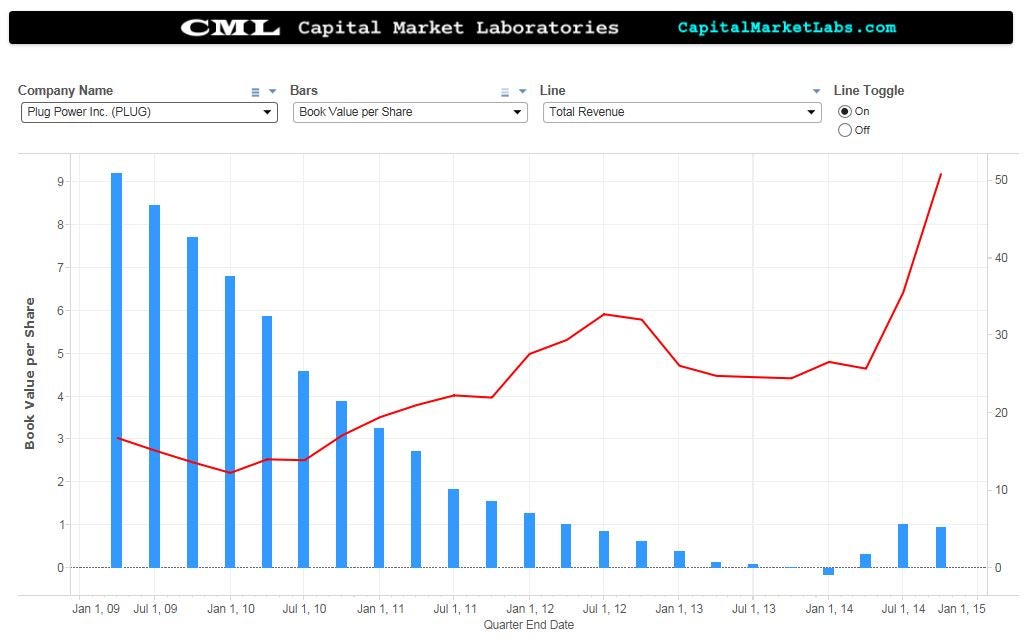
With the troubling margins, Plug's book value has failed to improve as revenues have grown. Take a look at this time series with book value per share in the blue bars and total revenue in the red line.

Next, let's compare Plug’s revenue growth to FuelCell Energy Inc FCEL (not necessarily a competitor), which is often grouped with the company.

Note how much quicker FuelCell has grown revenue than Plug, although Plug’s trend is up, while FuelCell’s trend is now down (these are TTM numbers). In the next two charts, focus on Plug’s mode of operation.
First, let’s chart research and development (R&D) in the blue bars and total operating expenses in the red line.

While operating expenses are growing (as the firm grows), R&D investment (expense) is actually declining. Plug is making a bet that it has the technology and products it needs to be profitable; now it’s time to scale.
The next visual focuses on selling general and administrative expense (SG&A) in the blue bars and gross margin percentage in the red line.

SG&A expense (TTM) has increased about 20 percent in the last year, but gross margins are finally increasing (cost of goods sold is decreasing relative to sales). That final red line is the key to Plug’s sustainability as a going concern.
If the firm can scale sales up and turn gross margins positive, it may be able to start generating positive cash flow from operations and ultimately positive earnings margins.
But Plug better do it soon...why?
This final chart has an answer. Let's now examine cash and equivalents (blue bars) to the cash ratio (red line).

A cash ratio of over 7 is very safe for now, and Plug has just under $160 million in cash, which is also ample. But, further down the line, a firm with a -220 percent earnings margin and negative gross margins will eat cash in a matter of several quarters.
Plug does have time for a year or more (barring a disastrous quarter), and has authorized a stock sale, but make no mistake, Plug is on the clock.
Great things may be coming. The firm has certainly shown promise of a successful enterprise in a potentially booming sector, but insolvency will creep back into the picture if gross margins remain negative, and if top line growth continues to miss company goals for the next several quarters.
Ophir Gottlieb can be found on Twitter @OphirGottlieb
© 2025 Benzinga.com. Benzinga does not provide investment advice. All rights reserved.
Trade confidently with insights and alerts from analyst ratings, free reports and breaking news that affects the stocks you care about.