Peter Brandt appeared on RealVision on Wednesday, sharing information on “classical charting pattern.” The trader explained that he does not follow global macro events, but rather, he looks at price graphs and “significant trading opportunities.”
He then went into an opportunity that has been showing up in the charts over the past couple of weeks and “has been sharply confirmed” on Wednesday: being long the U.S. dollar and short the Swiss franc.
The strongly opinionated man went on to assure that “if you are a currency trader and you are not long dollar, short Swiss, or looking for a place to be long dollar, short Swiss, you ought to quit what you’re doing and try to find a job at a local carwash.”
So, without further ado, let’s take a look at the charts that support the thesis that the U.S. dollar will see a substantial surge versus the Swiss franc.
A Historical Look

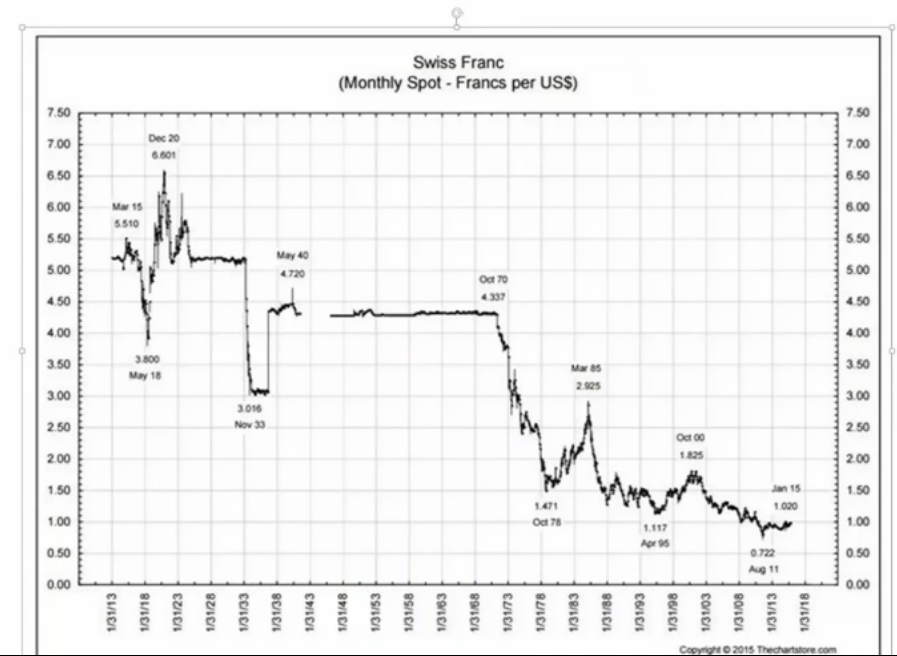
The first chart looks back at the Swiss franc versus the U.S. dollar over the past century. Currently, the U.S. dollar’s valuation versus the Swiss franc stands at “extreme lows” or, “what could be considered undervalued prices of the U.S. dollar versus the Swiss franc,” Brandt explained, pointing out that the rise of the U.S. dollar versus the franc seen on Wednesday is far from overdone – although many fear it is.
“We barely lifted off. In fact, we are just lifting off,” he assured. “This is a missile that is just finally cleared the tower and has a substantial move to go,” he added.
The expert went on to expound that it is usual to see market prices “retrace to levels that were previously levels of resistance.” In this case, he noted, the 1.117 level in April of 1995 could be seen as a resistance, adding that this is “a likely area for the market to go.”
Once markets get to resistance, investors could see them trade to areas of previous highs, Brandt continued – in this case, the October of 2000 high of 1.825.
The Monthly Chart
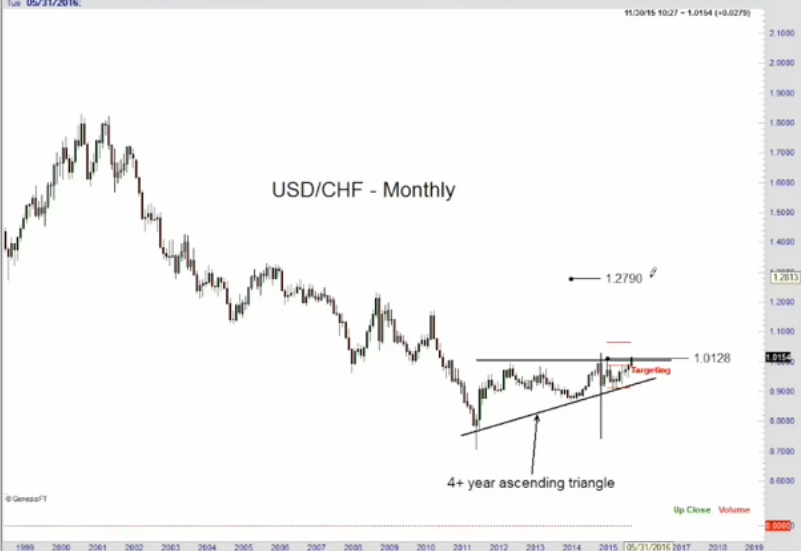
Later, Brandt shared a monthly chart of the U.S. dollar versus the Swiss franc, where the aforementioned bottom area takes the form of a 4+ year ascending triangle.

The expert said he believes a bottom is in place. In time, this bottom would establish a target of 1.279, implying an increase of more than 25 percent in the dollar-Swiss relation.
Why Is The Dollar Surging?
For investors to better comprehend the reason behind this surge in the U.S. dollar versus the Swiss franc, Brandt looked into the three-month euro-Swiss interest rate. “What we see presently is an historic all-time negative interest rate in the euro-Swiss. If you are a holder of Swiss francs, you are in a fact, paying a penalty of 95 basis points to hold the Swiss franc.”
The Daily Chart
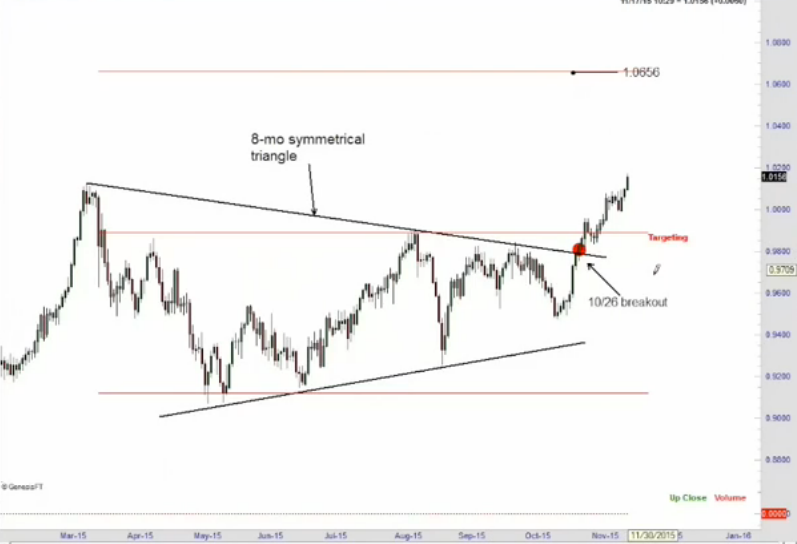
Finally, the analyst took a look at the dollar-Swiss franc daily chart.

In this case, “the market has formed an eight-month symmetrical triangle bottom. We broke out October 26th [...] this has definitely proven itself,” Brandt continued, adding that the first target in the daily chart is 1.0656 – well below longer-term targets.
Conclusion
To conclude, Brandt assured this is a long-term trade that “will unfold over the course of many months, perhaps as many as a year or more. There will be consolidations on the way to 1.20-1.25 [...] So, my recommendation is to have a base core position, to keep it, and look for opportunities to pyramid along the way when markets take a pause.”
Disclosure: Javier Hasse holds no positions in any of the securities mentioned above.
Image Credit: Public DomainEdge Rankings
Price Trend
© 2025 Benzinga.com. Benzinga does not provide investment advice. All rights reserved.
Trade confidently with insights and alerts from analyst ratings, free reports and breaking news that affects the stocks you care about.