
After finishing 2015 as the top performer in the entire S&P 500, Netflix, Inc. NFLX is already down 7.6 percent so far in 2016. Is Netflix’s historic run finally over, or does the stock still have technical support? Here’s a look at what the charts have to say.
First of all, there’s no question that Netflix has been in a downtrend since the beginning of December. However, to this point, the stock has not breached any major technical support levels, which puts it in a much better position than many other stocks.
Related Link: NBC Exec Not Worried About Netflix: 'People Watch TV The Way God Intended'
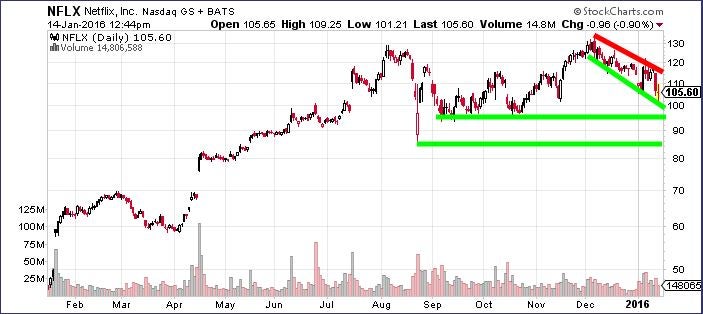
If the market continues downward, the first test for Netflix will likely come in the $93-96 level, where the stock found support several times in late 2015. Below that, the August flash crash low of $85 could also serve as support.
From a longer-term perspective, however, Netflix bulls should keep expectations tempered for 2016. Not only is it a lot to ask for the top stock in the S&P 500 to log a second consecutive year of outsized gains, Netflix has a history of consolidation in alternating years.
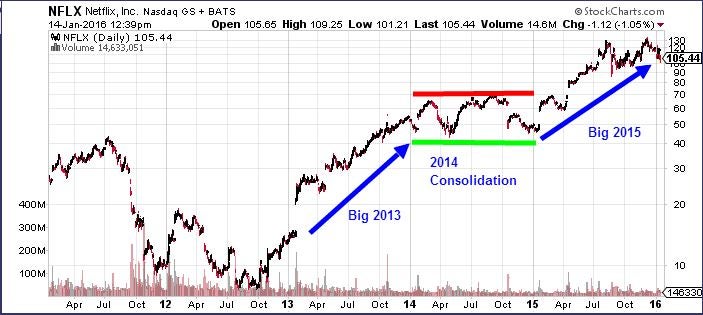
After a volatile but underwhelming 2012, Netflix booked big gains in 2013 only to trade mostly sideways throughout 2014. The stock resumed its gains in 2015, but if the pattern continues, Netflix could spend most of 2016 trapped inside a range between $90 and $130.
A breakout either above or below this range could be a signal that Netflix’s long-term pattern is changing, however, so traders should keep a watch on the hot stock throughout the year.
Disclosure: the author holds no position in the stocks mentioned.
© 2025 Benzinga.com. Benzinga does not provide investment advice. All rights reserved.
Trade confidently with insights and alerts from analyst ratings, free reports and breaking news that affects the stocks you care about.

