

"The trend is your friend." -Anonymous
As you're getting ready to rip into those presents, and watch your friends and family tear into theirs, I've also got a gift that should attract your attention.
But it's not going to be wrapped up with a bow. It won't have any tinsel on it, no Santa Clause motif paper, and no neatly folded corners.
Your significant other likely won't care to hear about the features of my gift. They won't want to share in the experience as you put it to use.
But they will likely love to be the beneficiaries as you use my gift.
My present to you is a breakdown of a select few technical analysis patterns. And while these aren't exactly holiday morning-type conversation topics, they'll help you make money. And money will help you buy more of those gifts.
Yesterday we went over the concept of technical analysis, and why it's relevant to any investor's strategy. If you missed yesterday's issue, view it on our blog website here. Today I'll go one step further and explain some basic technical indicators, and next week I'll get into further specifics, including head and shoulders, triangles and pennants.
If these sound like cheerleading formations, don't worry - you'll understand them and how they can help you make money in the stock market before the calendar flips to 2011.
***Technical analysis isn't just a tool for advanced day-traders and high-flying hedge fund gunslingers. Strong fundamental analysis is always crucial, but technical indicators can sometimes give you an added edge for specific entry and exit points.
As I said yesterday: "fundamental analysis helps you decide what to buy; technical analysis helps you decide when."
So let's unwrap this sucker.
The most basic premise in technical analysis is that specific patterns have meaning and tell you what the price is going to do next.
If the price of a stock moves toward new upper or lower levels and breaks through (on the stock chart), this often implies that a new trading range is being established. Or that a new short-term trend is occurring, and that prices are going to continue to move in the newly established direction. Equally important, if a price range test is made but fails, that often indicates that the price is now going to move in the opposite direction.
The first important technical indicator is called the trading range. This is the space between the highest and lowest price that a stock typically reaches within a period of time. The trading range defines volatility and also serves as the benchmark for most other indicators.
When a stock trades within a very narrow trading range volatility is said to be low - meaning the market risk is lower.
But risk has a flipside, called opportunity. So a narrow trading stock has both lower risk and lower opportunity.
The broader the range and the greater price movement within the range, the higher the volatility.
The top of the trading range is called resistance, because it is known as the price limit within the current trading range. It is the highest price that buyers have recently paid.
In the two year chart of Westport Innovations WPRT below you can see an example of two trading ranges. The range that was established in 2009 got much wider in 2010. The upper line is resistance, and the lower line is support. In 2010 there are two resistance lines, and the upper one has not been challenged since the end of July.
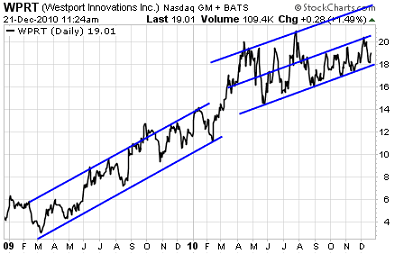

The more times a price touches resistance or support points, the stronger the level of support or resistance tends to be. If, in the chart above, the price now moves above the first resistance line, then finds support at that line it is more likely that that prior resistance line could become support.
***An important distinction has to be made between stationary and moving ranges. A stationary range remains level over time, and the moving range demonstrates an evolving price direction.
Another way that trading ranges evolve is in the breadth itself. If a trading range of the recent past covered about $4, like Westport's 2009 range, but then expands to around $6, like Westport did in early 2010, volatility is said to increase (it has wider breadth).
If a stock's price range is trending upward, but the breadth of the range remains the same, then the stock is not becoming more or less volatile. This was the case with Westport in 2009. The same is true if price is trending to the downside; as long as the trading range's breadth is unchanged.
As you track the stocks of growing small-cap companies a rising price level with unchanged trading breadth is a very strong sign and can indicate that future growth will continue to follow this trend.
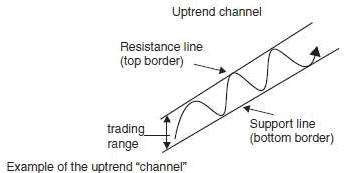
The following illustration below from my book, The Small-Cap Investor: Secrets to Winning Big with Small-Cap Stocks, shows an example of a rising prices without a change in breadth. Note how the breadth of this evolving range holds the same range even as prices grow. Resistance and support both rise, but the breadth does not show any increase or decrease in volatility. Note how this is similar to the two periods in Westport's chart: 2009, and the second half of 2010.
There are two types of breakouts that you should be on the lookout for: the downside break-down, and the upside breakout.
These occur when a stock breaks its established trading range, and can signal either a shift to a lower trading range (stock breaks down) or a higher trading range (stock breaks higher).
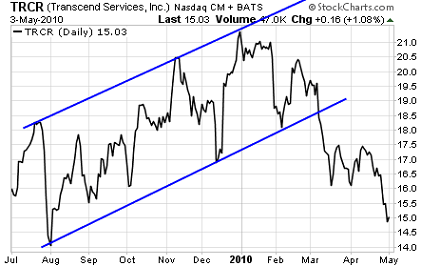
The chart below of Transcend Services, TRCR, a medical records transcriptions company, shows an example of a channel breakdown. In early March, 2010, this stock broke through the channel, and didn't stop falling until it had shed $4 per share.

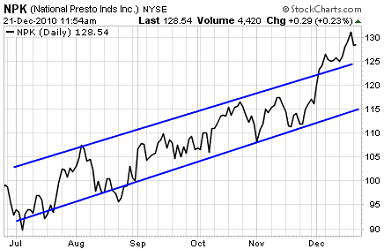
Conversely, the three month chart below of consumer goods manufacturer National Presto NPK, shows a breakout. The stock broke above resistance in the beginning of December, and hasn't looked back since. Watch this stock to see if resistance become support now - if it does it should be around $125, and that would be a good price at which to pick up some shares.

We'll get back into this some more on Monday. We won't be publishing tomorrow, so if you don't receive this letter, don't fret!
Have a great, safe, and relaxing holiday weekend.
© 2025 Benzinga.com. Benzinga does not provide investment advice. All rights reserved.
Trade confidently with insights and alerts from analyst ratings, free reports and breaking news that affects the stocks you care about.

