(DO NOT FORWARD)
By analyst Gianni Di Poce
Volume 3.39
Market Overview (Member Only)
- The Nasdaq reassumed leadership in the stock market rally last week, as it finished up 0.95%. The S&P 500 rallied 0.62%, while the Dow Jones Industrial Average was up 0.59%.
- The bigger stock headline last week was the Chinese market. The Shanghai Composite rallied over 12.8% and seemingly reignited a bull trend.
- Inflation came in soft again, but this not may last much long as the money printing is underway.
- Cryptos continue to build on their solid technical base.
Stocks I Like
- Tencent Holdings (TCEHY) – 23% Return Potential

What's Happening
- Tencent Holdings (TCEHY) is a Chinese holding company that offers value-added services like online advertising, fintech, and more.
- The company made $609.01 billion in revenue in 2023 along with $115.22 billion in earnings.
- TCEHY has an elevated valuation. Its P/E is at 70.23, its Price-to-Sales is at 9.15, and its EV to EBITDA is at 60.37.
- From a technical perspective, TCEHY just experienced a bullish breakaway gap from a saucer formation. This is a very bullish development and suggests a new bull run is underway.
Why It's Happening
- The end of China's crackdown on its technology sector is expected to be a huge contributing factor behind renewed investor optimism in Chinese technology stocks. In Tencent's case, the resumption of gaming license approvals appears to have been a particular tailwind, as evidenced by the success of DnF Mobile — revenue from which will be recognised in Tencent's next earnings release.
- Tencent's Dungeon & Fighter Mobile (DnF Mobile) has topped China's charts for both downloads and revenue since its 21 May release. DnF Mobile generated $270m on iOS during its first 30 days, making it Tencent's most successful release of 2024.
- Analysts on the street have been greatly optimistic about the prospects of Tencent Gaming in the next few years. Xiao Feng Zeng, Vice President at Niko Partners, revised his estimate for the game's gross revenue during 2024 to RMB15–18bn. Besides, Goldman Sachs analysts Ronald Keung and Lincoln Kong wrote that "it is reasonable to conclude DnF Mobile will be China's biggest new game launch in 2024 and Tencent's most commercially successful new game in the past five years".
- Tencent is a firmly established player in certain high-growth markets in China. For example, as of Q4 2023, Tencent is China's third-largest cloud services provider, with 16% of the market, trailing Alibaba (39%) and Huawei (19%). Research firm Canalys expects the Chinese cloud infrastructure services market will grow by 18% in 2024.
- Tencent is relatively efficient at converting its revenue into profits. Over the trailing 12 months, its operating margin is 32.95%. This is more than double that of Alibaba, which has an operating margin of 13.35%, and eclipses JD.com's, which stands at 2.96% over the same period.
- TCEHY has a free quarterly cash flow of $1.34 billion.
Analyst Ratings: - Barclays: Overweight
My Action Plan (23% Return Potential)
- I am bullish on TCEHY above $47.00-$48.00. My upside target is $70.00-$72.00.
2. Pegasystems (PEGA) – 16% Return Potential
What's Happening
- Pegasystems (PEGA) develops, markets, and supports enterprise software in the United States.
- The company made $1.43 billion in revenue in 2023, along with $67.81 million in earnings.
- PEGA's valuation is elevated. Its P/E is at 48.74, its Price-to-Sales is at 4.16, and its EV to EBITDA is at 34.58.
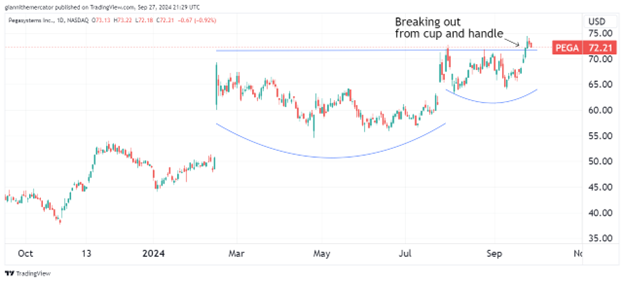
- From a technical standpoint, PEGA is looking to breakout from a cup and handle formation. This could lead to an acceleration in upside momentum if successful.
Why It's Happening
- Of all the applications for artificial intelligence (AI), customer service is one of the most common. Companies big and small have been using tools like AI customer service bots and voice assistants to handle customer requests and algorithms to improve product recommendations and user experiences. PEGA which uses tools like natural language processing and intelligent chatbots to provide customer support are uniquely positioned to benefit from this industry tailwind.
- CEO Alan Trefler was highly optimistic that the company is able to generate more lucrative deals and revenue pipeline in the next year in virtue of innovative improvements of existing solutions, quoting “We delivered transformative innovation to change the way the world builds software while deepening and expanding our client relationships”.
- Management also said it was on track “to achieve the Rule of 40 as we exit 2024,” meaning its revenue growth rate and free cash flow margin combined will be at least 40%. If both of those targets can be hit, expect the stock price to see massive appreciation due to bullish inflows from institutional investors and retails alike.
- Pegasystems’ revenue growth accelerated from earlier in the year to 20%, reaching $474.2 million, which was much better than the consensus estimate of $413.6 million.
- Growth in annual contract value increased 11% to $1.26 billion as the company is seeing demand for AI products start to ramp up. This earnings report came out just days after Pega introduced Pega GenAI Blueprint, a collaborative generative AI application intended to “turbocharge the app design process.”
- Pegasystems’ free cash flow (FCF) jumped 119% to $218 million in the second quarter.
Analyst Ratings: - Loop Capital: Buy
- JP Morgan: Overweight
- Rosenblatt: Buy
My Action Plan (16% Return Potential)
- I am bullish on PEGAabove $61.00-$62.00. My upside target is $84.00-$86.00.
3. Newmont Corporation (NEM) – 44% Return Potential
What's Happening
- Newmont (NEM) is a precious metal and mineral mining company with operations around the globe.
- The company generated $11.81 billion in revenue during 2023, but still lost $2.49 billion on the year.
- NEM's valuation is fairly elevated. Its Book Value is 25, while its Price-to-Sales is at 3.83, and its EV to EBITDA is at 52.89.
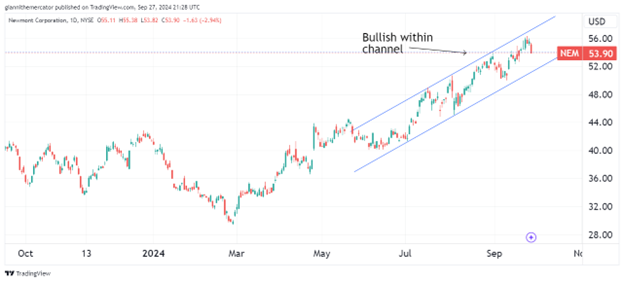
- From a charting perspective, the stock remains bullish as long as it stays within the ascending price channel.
Why It's Happening
- After rising 14.6% in 2023, gold prices continued to soar through the first half of 2024 as gold bugs drove the price of the yellow metal up another 12.2%. And some don’t believe that the price will be ebbing anytime soon. J.P. Morgan, for example, forecasts the price of gold will average $2,500 per ounce in the fourth quarter of 2024. The sustained surge in gold prices is bound to lift the stock prices of gold miners like NEM.
- Newmont is the largest gold stock available to investors, forecasting 2024 gold production of 6.9 million ounces. Its portfolio of assets is located throughout the Americas as well as Africa and Australia, giving it a considerable global presence. Hence, it’s one of the largest miners that are positioned well to benefit from the precious metal bull market.
- The company appears a lot more attractive now since it closed on its acquisition of Newcrest in November. Newmont expects the transaction to immediately add value, projecting that it will achieve $500 million in pre-tax synergies in the two years following the closing of the deal as well as a minimum of $2 billion in cash improvements through portfolio optimization during the same period.
- One of the especially alluring qualities of Newmont is its attention to rewarding shareholders. The company has a unique dividend policy among gold stocks in that it distributes a fixed dividend of $1 per share (at a gold price of at least $1,400 per ounce) and a variable dividend based on the company’s free cash flow. Currently, Newmont’s stock offers a juicy 4% forward-yielding dividend.
- NEM intends to repurchase $1 billion in stock over the next two years, with the possibility that the company elects to raise its dividend after restructuring its portfolio. With shares valued at 9.8 times operating cash flow — just under their five-year average cash-flow multiple of 9.9 — now seems like a great time to pick up shares of this premier gold stock at a reasonable price.
- Those concerned about whether the company is jeopardizing its financial health to appease investors can rest assured thanks to the company’s conservative approach to leverage. At the end of Q3 2023, Newmont had a net-debt-to-adjusted-EBITDA ratio of 0.7 — below the company’s targeted ratio of 1.
Analyst Ratings: - UBS: Buy
- Argus Research: Buy
- Scotiabank: Sector Outperform
My Action Plan (44% Return Potential)
- I am bullish on NEMabove $48.00-$49.00. My upside target is $78.00-$80.00.
Market-Moving Catalysts for the Week Ahead
GDP Stronger than Expected – As Expected
Well we finally got the final update for Q3 GDP, and the print came out exactly in alignment with our expectations. It turns out the economy grew 3.0% in the second quarter, while the estimated revisions were looking for around 2.9% growth.
My base case regarding this outlook is that there was a recession in 2022. I've been calling it the double-dip recession from 2020, after consumers dramatically changed their behavior following the inflationary surge. It may have even been the quickest recession to unfold after a yield curve inversion.
Listen, just because commentators say 2022 wasn't a recession does mean it's true. There were two negative quarters of GDP in 2022, which is no different from what we saw in 2020. If the definition-makers want to modify what a recession means to include a magnitude of a contraction, I'm here for that discussion, but until that happens, the traditional definition was satisfied.
PCE and Inflation Updates
The Fed's preferred metric, the PCE index, came in below estimates last week. The report showed a 12-month inflation reading of 2.2%, while it rose 0.1% for the prior month. This is unsurprising given the price action of commodities, and especially energy, as of late.
The Fed likes the PCE report better than the CPI report because it allows for the substitution of goods and services. Obviously, when consumers start to feel the pinch, they're more likely to opt for less-expensive alternatives.
Inflation can provide the illusion of economic growth due to rising prices, but with consumption being the backbone of the U.S. economy, it's imperative that inflationary pressures remain contained when it comes to maintaining growth. I don't think there's an imminent danger of a recession again unless prices start rising considerably again.
China's Market Renaissance
All around the world, we're seeing more and more stimulus from governments and central banks. The only real exception from this, in terms of developed economies, is Japan. But to keep proper perspective – Japan's rates are still significantly lower than its economic peers.
The Chinese equity market exploded higher last week as another round of stimulus was announced, both by the People's Bank of China, and the politburo. Property stocks led the market higher, which were the main ones causing problems for Chinese equity indices.
I have a really important ratio chart below that shows how we could be at a major turning point between U.S. and Chinese stocks. Much of it may have to do with the Dollar from a macroeconomic standpoint as well. But lower rates in the U.S. actually helps China too.
Real Estate & Interest Rates
Last week, we saw existing home sales rise up off the lows, but it's too early to tell whether it will just be a dead-cat bounce or not. But from a fundamental standpoint, I think markets are shaping up to make 2025 a very busy year for the real estate market.
Interest rates on the 30-year mortgage are at the lows of the year, and it looks like they are going to continue lower at least for the next several months. This has real potential to ignite a torrid period of real estate transactions, but as we're nearing the end of prime homebuying season, there may be some lag time.
Psychologically, it's much easier for homeowners to go from a 3% mortgage rate to a 5-5.5% mortgage rate. I think we'll really start to see real estate transactions accelerate once the 30-year mortgage drops below 6%.
Sector & Industry Strength (Member Only)
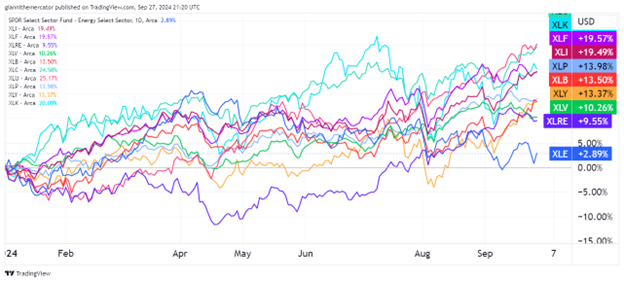
The sector performance rankings showed some improvement this past week, which bodes well for stocks heading into the fourth quarter, which begins on Tuesday. Utilities (XLU) are still the top-performing sector year-to-date, something I'd like to see change, but we're seeing internal improvements too.
Technology (XLK) jumped a spot and overtook financials (XLF) last week, the latter of which has started to lag since the Fed started cutting rates. Communications (XLC) being in second-place is still a boon for bulls.
The spread between consumer discretionary (XLY) and consumer staples (XLP) narrowed significantly again last week, and now, XLY is only around 1% behind XLP. If XLY overtakes XLP in the rankings, it will very much be a risk-on signal.
| 1 week | 3 Weeks | 13 Weeks | 26 Weeks |
| Basic Materials | Consumer Discretionary | Real Estate | Utilities |
Editor's Note:
Basic Materials reclaiming the one-week leader after it was energy the previous week – inflation trade seeing some inflows here.
China's Rebound (Sector ETF: FXI/SPY)
After big news of huge economic stimulus over in China, it's only fitting that we check back in on the ratio between large cap Chinese stocks (FXI) and large cap U.S. stocks (SPY). It's been years since China displayed any measurable sort of outperformance.
The series of lower-lows and lower-highs in this ratio have told the story of capital flows between the U.S. and China. Despite calls for China overtaking the United States as the global economic superpower, the capital flows between the two countries have had other ideas.
While the headlines say that the pop in the Chinese market is due to new stimulus, I would argue it's actually coming from the Fed and the renewed monetary easing. We just broke the downward sloping trendline on the ratio chart below, which means the ratio of descent is nullified. Now we just need to see some higher-highs and higher-lows form in this ratio to see if this breakout in China is for real.

Eyes on Commodities Versus Bonds (Sector ETF: DBC/TLT)
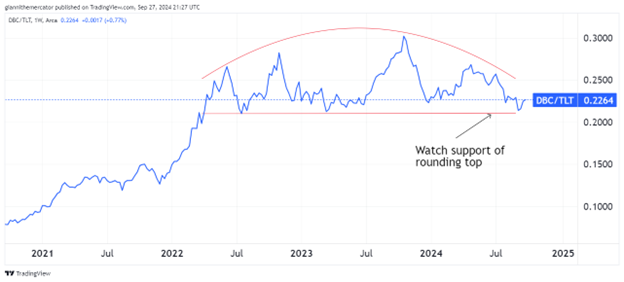
As the market cheers stronger liquidity concerns, and higher stock prices, it's important to not forget about the intermarket dynamics between asset classes. This is especially the case when it comes to the ratio between commodities (DBC) and long-term Treasuries (TLT).
Remember that the Fed is printing money again, and they started doing so before inflation dropped below the central bank's 2% annual inflation target. The ratio between DBC and TLT offers more profound insights to the inflation situation compared to laggard economic data or Fed-speak.
There appears to be a rounding top formation in this ratio. A breakdown would be in tremendous favor of TLT over DBC, but the longer it avoids doing so, the greater the odds that this evolves into a consolidation within a longer-term bull trend. In this situation, it could be a prelude to a return of inflation in the coming months.
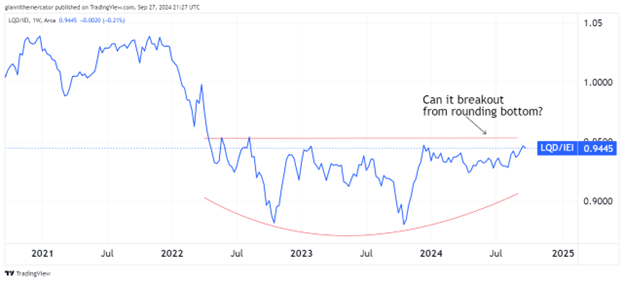
The Big Break in Liquidity (Sector ETF: LQD/IEI)
This may be one of the most important charts in the entire market right now – the ratio between investment-grade corporate debt (LQD) and 7-10 year Treasuries (IEI). The reason being is because we just started a new round of monetary stimulus, which increases liquidity conditions.
Interestingly, this ratio has been on the up ever since the market bottom back in October 2022. It's a very strong leading indicator of stock market conditions, and typically, when spreads blow out, the risk of a stock market crash increases.
Fortunately, we're seeing the opposite right now. Credit spreads have been narrowing, and it looks like we're on the cusp of a major breakout from a rounding bottom formation in this ratio, which means liquidity conditions could improve even further.
Editor's Take:
We continue to be in a liquidity-driven market. We saw what happened when the Fed pulled the plug back in 2022 – and it wasn't pretty. This leads me to believe that the market is really at the mercy of accelerating inflation.
This is where the real danger lies. The economy is fundamentally different than it was years ago. That doesn't mean that market cycles don't exist, but there is more demand for labor now than in the past decade.
As long as unemployment doesn't spike, the risk for this market remains on the inflation end of the equation. That is, a rise in inflation may eventually cause the Fed to pivot again, although I don't think that will be evident for at least another 9 months.
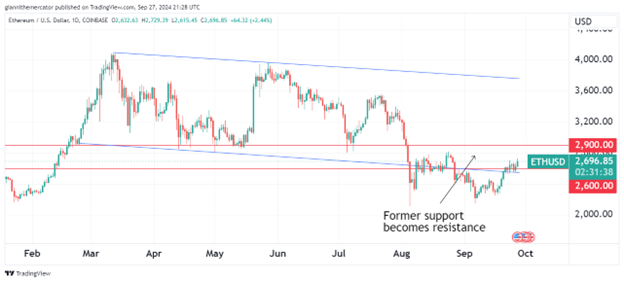
Back to looking at Ethereum this week, because the price action here is at a critical juncture once again. Prices continue to press into former-support-turned-resistance at 2600-2900. Above that zone, there's a strong case that a low of significance is complete in Ethereum.
Prices are trying to get back into the descending price channel in which prices spent most of the year correcting. If it turns into a false-breakdown in Ethereum, we could see an explosive rally to the upside. As the saying goes, "From false moves, come fast moves."
I've likened Ethereum and Bitcoin to silver and gold. Ethereum is like silver and Bitcoin is like gold. Silver and Ethereum tend to act like leveraged positions in both Bitcoin and gold, so if a real crypto run is starting, then I think Ethereum will come back to life very shortly.
Legal Disclosures:
This communication is provided for information purposes only.
This communication has been prepared based upon information, including market prices, data and other information, from sources believed to be reliable, but Benzinga does not warrant its completeness or accuracy except with respect to any disclosures relative to Benzinga and/or its affiliates and an analyst’s involvement with any company (or security, other financial product or other asset class) that may be the subject of this communication. Any opinions and estimates constitute our judgment as of the date of this material and are subject to change without notice. Past performance is not indicative of future results. This communication is not intended as an offer or solicitation for the purchase or sale of any financial instrument. Benzinga does not provide individually tailored investment advice. Any opinions and recommendations herein do not take into account individual client circumstances, objectives, or needs and are not intended as recommendations of particular securities, financial instruments or strategies to particular clients. You must make your own independent decisions regarding any securities, financial instruments or strategies mentioned or related to the information herein. Periodic updates may be provided on companies, issuers or industries based on specific developments or announcements, market conditions or any other publicly available information. However, Benzinga may be restricted from updating information contained in this communication for regulatory or other reasons. Clients should contact analysts and execute transactions through a Benzinga subsidiary or affiliate in their home jurisdiction unless governing law permits otherwise.
This communication may not be redistributed or retransmitted, in whole or in part, or in any form or manner, without the express written consent of Benzinga. Any unauthorized use or disclosure is prohibited. Receipt and review of this information constitutes your agreement not to redistribute or retransmit the contents and information contained in this communication without first obtaining express permission from an authorized officer of Benzinga. Copyright 2022 Benzinga. All rights reserved.
© 2025 Benzinga.com. Benzinga does not provide investment advice. All rights reserved.
Trade confidently with insights and alerts from analyst ratings, free reports and breaking news that affects the stocks you care about.