Your Exclusive Benzinga Insider Report
(DO NOT FORWARD)
By analyst Gianni Di Poce
Volume 3.48
Market Overview (Member Only)
Stocks I Like
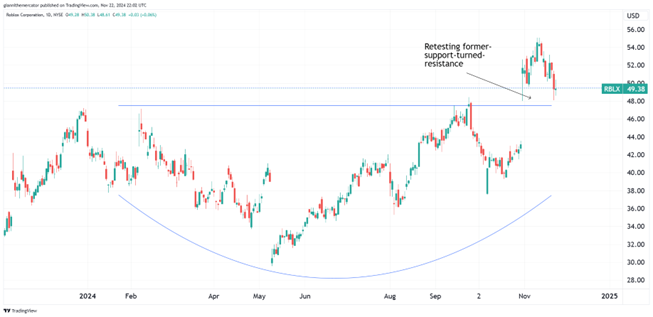
Roblox (Ticker: RBLX) – (52% Return Potential)
What's Happening
Why It's Happening
Analyst Ratings:
- Citigroup: Buy
- Deutsche Bank: Buy
- Morgan Stanley: Overweight
My Action Plan (52% Return Potential)
- I am bullish on RBLX above $45.00-$46.00. My upside target is $75.00-$77.00.
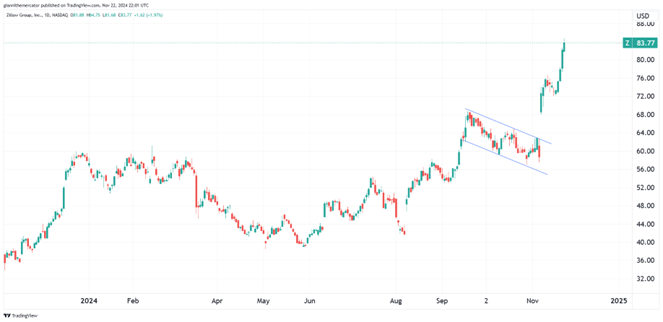
Zillow (Ticker: Z) – (25% Return Potential)
What's Happening
Why It's Happening
Analyst Ratings:
- Needham: Holding
- Jeffries: Buy
- B of A Securities: Neutral
My Action Plan (25% Return Potential)
- I am bullish on Z above $63.00-$64.00. My upside target is $105.00-$110.00.
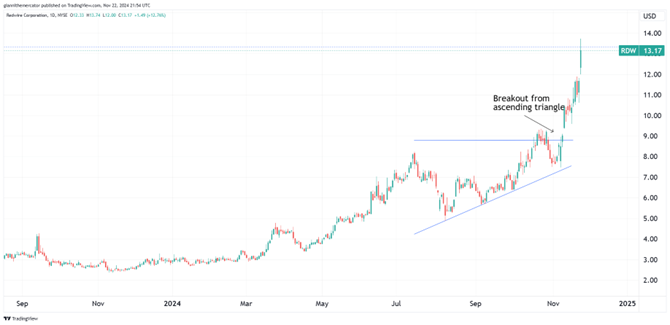
Redwire Corporation (Ticker: RDW) – (52% Return Potential)
What's Happening
Why It's Happening
Analyst Ratings:
- Roth MKM: Buy
- B. Riley Securities: Neutral
- Cantor Fitzgerald: Overweight
My Action Plan (52% Return Potential)
- I am bullish on RDWabove $9.50-$10.00. My upside target is $20.00-$22.00.
Market-Moving Catalysts for the Week Ahead
The War Drums Are Beating
The situation over in Eastern Europe may be at its most critical since the conflict began in early 2022. The Euro continues to crash after Russia launched an ICBM (intercontinental ballistic missile).
However, as I'll demonstrate below, I find the market's reaction to these developments to be peculiar. Don't you find it odd that crude oil isn't surging higher as the war drums are beating? And if you look at the Japanese Yen, it's paused in its drop against the Dollar too.
Whenever a headline is dominating the market, I always pay special attention to the sectors associated with it. Of course, this could all change quickly, but at the end of the day, if nuclear war is on the horizon, then nothing we do in our portfolios will matter much.
More Inflation Data Coming
This week, we have very key inflation data, and it's the Fed's favorite metric—the Personal Consumption Expenditure (PCE) index. The Fed likes this reading of inflation because it allows for the substitution of goods and services.
I'm not expecting much out of this report, mainly because commodity prices have been contained for most of this year. Remember that this type of economic data is laggard in nature – it only tells us about the past.
Expectations for the month of October are for an increase of 2.1% year-over-year and 0.2% month-over-month. There's also the first revision of Q3 GDP, and analysts are looking for a growth rate of about 2.8%.
Holiday Trading Begins
I talk a lot about the cyclical nature of markets in this report, but every once in a while, I like to bring up seasonality. To be clear, the cycles I'm referencing are a bit different than seasonality, but they are connected to an extent.
As it turns out, stocks tend to perform better in certain months compared to others. Aside from April, November and December have been the top-performing times for stocks over the past couple of decades.
Many people are familiar with the Santa Claus rally but that actually doesn't start until after Christmas. But even before then, the investment community tends to get into the holiday spirit by bidding stocks higher. Let's see if it pans out again this year.
Is Full-Blown Mania Coming in 2025?
After the election, we saw a lot of traders and investors chase the stock market's breakout. It was only natural that we saw a few consecutive sessions of selling afterwards. The market loves to make a fool out of the largest number of people.
But going into 2025, I think the groundwork is there for a full-blown mania to unfold. We have the Fed lowering interest rates and adding liquidity to this market, and there is the potential for major reforms at the fiscal level.
In order for this market to fully top out, we need to enter an environment where the majority is completely ecstatic about the market environment. And we are simply not there yet. The closest comparison would be late-2021/early-2022. I think there's still a distance to go.
Sector & Industry Strength (Member Only)
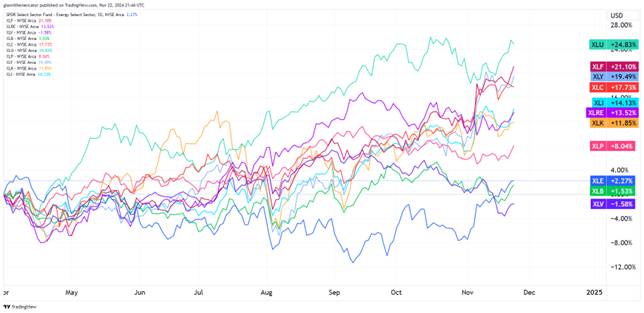
As I mentioned last week, it's time to tighten up the time horizon to compare the sector performance rankings. So, going into year-end, we'll be looking at the various sectors and how they've performed since the start of the second quarter 2024.
Compared to the year-to-date numbers, we see a much different tape from the start of Q2. Utilities (Ticker: XLU) is comfortably in first place. In 2nd through 4th place, it's a tight race between financials (Ticker: XLF), consumer discretionary (Ticker: XLY), and communications (Ticker: XLC). None of these are bearish.
I would prefer to not have utilities (Ticker: XLU) as the top-performer, but I think A.I. has a lot to do with it. Seeing defensive sectors like healthcare (Ticker: XLV), energy (Ticker: XLE), and consumer staples (Ticker: XLP) hanging out near the bottom, however, is a good sign for bulls too.
| 1 week | 3 Weeks | 13 Weeks | 26 Weeks |
| Basic Materials | Financials | Consumer Discretionary | Consumer Discretionary |
Editor's Note: The comeback of the consumer may be adding some kindling to the inflationary flames.
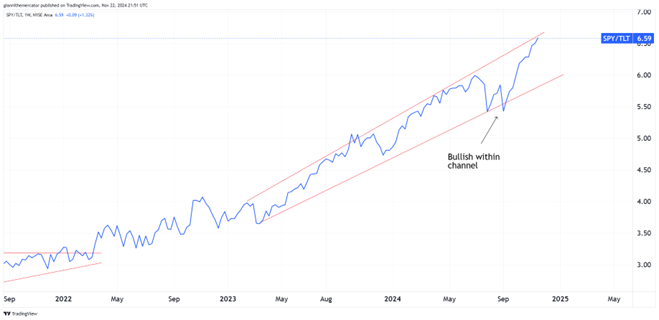
Update on Classical Risk Indicator Sector ETF: (Ticker: SPY) (Ticker: TLT)
It's time to check in on one of the market's most classic indicators when it comes to gauging appetite for risk the ratio between stocks (SPY) and long-term bonds (TLT). The logic here is simple… when stocks outperform bonds, it's risk-on, when bonds outperform stocks, it's risk-off.
This ratio has been in a clear uptrend within the ascending price channel for years. This is observed by the series of higher-highs and higher-lows. Basically, this means that you've been able to grow your money at a substantially higher rate owning stocks over bonds.
Note that the ratio is approaching the upper end of the channel here. Don't be surprised if it starts to slow in its rise, or even if we see TLT outperform SPY for a bit. I still think rates are coming down next year, but as long as this ratio keeps rising, we'll stay risk-on.
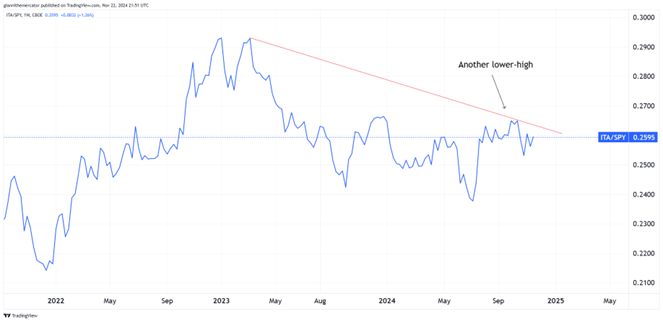
Markets and Geopolitics Sector ETF: (Ticker: ITA) (Ticker: SPY)
The war drums have been beating over the past week, as threats of a further escalation over the conflict in Ukraine seem to be reaching another tipping point. While stock markets have chopped around, we haven't seen complete and total selling yet – what gives?
Whenever there's a particular headline that is dominating the air waves, I always like to check on the sectors related to the news to see the full picture. So, this week, we're looking at the ratio between defense stocks (ITA) and the S&P 500 (SPY).
For this ratio, I'd be looking for ITA to outperform SPY if the market was pricing in a serious escalation of geopolitical tensions. But we're not seeing that at all right now – on the contrary, the ratio is in a downtrend. As always, cooler heads will prevail.
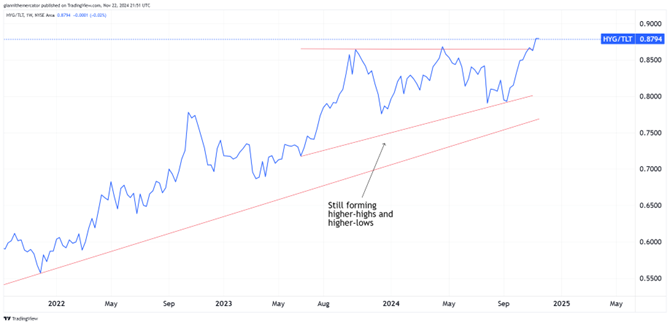
Flows into Junk Debt Continue Sector ETF: (Ticker: HYG) (Ticker: TLT)
It's generally known and accepted that the bond market is where the "smart money" plays. In fact, it's why I make a point each week to include at least one review of a bond market ratio. We have to know what that market is thinking at all times.
This week, we're looking at the ratio between junk bonds (HYG) and long-term Treasuries (TLT). The difference between these two types of bonds is stark—they're at the opposite ends of the risk spectrum.
As a result, this ratio gives us a great insight in terms of what the bond market is expecting in terms of risk in the market right now. When the ratio trends higher, or when HYG outperforms TLT, it's a very strong risk-on signal.
Editor's Take:
It's well-known that junk bonds tend to trade in a similar manner to stocks. Unlike other bonds, junk debt isn't back by anything—just a promise from a corporation that they'll pay you back. They offer higher yields in return.
In strong markets, junk debt offers investors a way to obtain higher yields, as well as some appreciation on their principle. Typically, before the stock market corrects, junk debt starts to sell off.
But this can be taken a step further—typically, TLT will react first and start outperforming HYG beforehand. This is why it's imperative to watch this ratio. It looks like we're about to breakout from a triangle formation too. This signals more liquidity in markets.
Cryptocurrency
We are looking at (Ticker: XRP) this week, which has gone parabolic over the past week, and even more so, in the past month. Ripple has tripled since mid-October and at this point, it would be best to see it go sideways for a bit.
However, when it comes to the longer-term trend. It's still very much higher. This looks to be the formation of an epic flag pole, which could eventually lead to a period of "flagging" or sideways consolidation.
This could eventually lead to XRP rallying as high as $2.50-$2.80. If it gets there too fast, it would actually be a bad sign. Markets that rise to fast fall just as fast. The path of least resistance remains higher in Ripple as long as it's above 1.05-1.10.
Legal Disclosures:
This communication is provided for information purposes only.
© 2026 Benzinga.com. Benzinga does not provide investment advice. All rights reserved.
To add Benzinga News as your preferred source on Google, click here.