Cryptocurrency trading is charged with diverse strategies based on different concepts, methods, and techniques, some with fundamental backgrounds and others with technical considerations. Two critical concepts support every trading method: supply and demand.
Supply and demand are ideas that transcended the economic field. These concepts explain the price fluctuations and different market conditions. In trading, they help to identify key price levels and seize opportunities around them.
This article discusses some relevant points to develop “The Ultimate Crypto Trading Strategy for Consistent Profits.”
Supply and Demand: What are they?

The price of an asset, physical or digital, is determined by the willingness of a potential group of buyers to pay a price for it. On the other hand, sellers establish a valuation for what they expect to be paid.
Amongst both forces, a final price surges amid the negotiation. This is a dynamic that affects all tradable assets.
Supply and demand concepts help to understand the relationship between price, valuation, and scarcity of assets in financial markets. They point out two facts:
- Supply is the total offering or available quantity of an asset that participants in a market will sell.
- Demand is the total buying power of market participants driven by a high desire to acquire an asset.
Supply and demand determine when the price of an asset is likely to head up or down as the desires of buyers or sellers exceed each other. This fact reveals two fundamental situations:
- When there are more sellers than buyers, the supply of an asset increases since demand remains lower.
- When more buyers than sellers take action, the demand for an asset increases as supply remains lower.
Mastering supply and demand as the ultimate trading strategy for crypto will guarantee an edge when analyzing charts.
To learn more, you can dive deep into this free PDF and download Your Path to BTC Millions.
Volatility, Supply and Demand
Among buyers and sellers, there is always a bidding that, at the end of a speculative process, births out a final price that reflects the valuation of an asset.
Such a valuation may undergo minimal or severe price fluctuations as several fundamental and technical elements make the price change rapidly or slower, showing signs of underlying volatility.
Supply and Demand In The Crypto Market
Along the commodities market, stock market, and, more recently, the crypto market, the technical techniques to spot and determine key price levels have the basis of supply and demand concepts.
The crypto market moves according to highly speculative activity, shaping the volatile outcomes. However, amid them, the market creates critical price zones influenced by accumulation and distribution phases, which traders use to determine key price levels.
Understanding Supply and Demand Levels In Crypto Trading
The assets tend to pass through severe price variations as traders enter and leave the market on losing or winning positions. Many of these positions are managed by high-capital traders or institutional players whose buying and selling powers can move the price from one quotation to another.
When the price moves sharply with high volume, it signals potential participation in entering large order inflows in the market. This inflow makes the price move higher when the demand overcomes the supply. Otherwise, it moves down. In both cases, the orders leave a mark in a zone where the price is expected to react since the zone is charged with orders waiting to be filled.
Such a wave of orders typically scatter across a price range as traders and investors accumulate or distribute. Effectively breaking the range up or down implies a high interest in either direction following the accumulation or distribution phases.
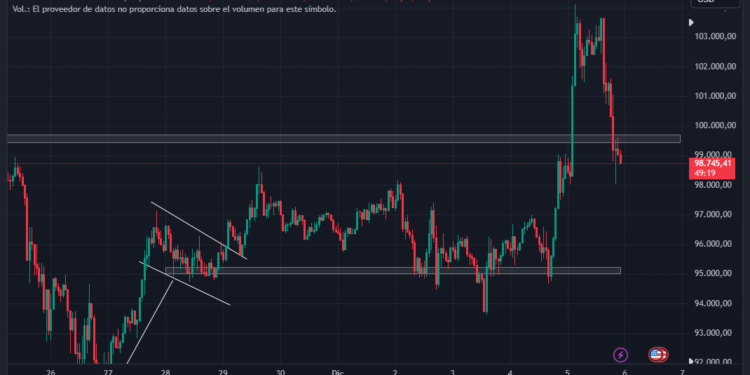
Those breaking points are later used to trace support and resistance areas where the price bounces when it reaches those areas. Key price levels can be spotted when these support and resistance areas react strongly.
Understanding how much supply or demand there is around support and resistance zones is a prior step to identify key levels.
To identify such levels appropriately, you can unlock all the potential of Free Tradingview Charts with Altrady via this Free PDF available for download.
To get access to TradingView Pro charts, you simply need to go to the Altrady site and register a FREE PAPER TRADING account.
How to Identify Key Levels
Key price levels emerge across diverse support and resistance price zones. Some levels are dynamic, as those found in trending markets, or linear, as those seen in specific areas along a range-bound condition.
In uptrend and downtrend markets, the price tends to find support or resistance during pullbacks around previous breaking points. For example:
- When the price rises above resistance levels, it will retrace to the last breaking point, forming a support.
- When the price declines below support levels, it will get back toward that recent breaking point with a likelihood of creating new resistance.
The latter explanation unveils the underlying dynamic pointed out by the typical phrase “previous support zones become future resistances and vice versa.” By understanding this dynamic, traders can identify key price levels effortlessly.

In range-bound markets, the price finds clearly defined support and resistance. Typically, it does so around round numbers or quite similar prices.
Let’s learn more about each scenario and how to identify such levels.
Horizontal Support and Resistance
In the technical analysis, as the price of crypto gets momentum, heading up or down substantially, it leaves zones of clustered orders that traders highlight with horizontal lines demarking specific prices. These are horizontal lines marked across the market structure where the price has reacted multiple times in the chart.
In these scenarios, the price attempts to move above a level but gets shoved back down when there is strong supply or tries to go below a level but finds demand. Round numbers occasionally act as strong psychological support or resistance levels, causing quick and significant price action.
One reference that explains how to identify and seize this type of supply and demand levels is Maurice Kenny, who employs and promotes a simple strategy based on these concepts.
Trendline Support and Resistance
The dynamic behind a trending market boils down to the price, making higher highs and higher lows in uptrends or lower highs and lower lows during downtrends. These highs in downtrends or lows in uptrends serve as key levels for drawing lines to identify the prevailing trend direction.
Two scenarios can emerge from the price action near these lines:
- When the price touches and bounces off a trendline, it might indicate a trend continuation.
- A decisive breakout below or above a trendline occurring during an uptrend or downtrend might suggest an upcoming trend reversal.
By appropriately drawing trendlines around consistent higher lows during uptrends and lower highs in downtrends, traders can discover more than trends but potential levels of a price rebound.
Using Technical Indicators
- Fibonacci Support and Resistance Levels: Fibonacci is a series of numbers with specific ratios. Fibonacci retracement levels indicate potential zones where the price might retrace or pull back before it continues a trend. Fibonacci extensions are used to forecast possible price targets following a breakout.
- Moving Average Support and Resistance: Moving averages are charting indicators that smooth out price movements and create dynamic lines on the chart. The price usually encounters support or resistance near the moving average line, especially key moving averages like the 50-day or 200-day. The longer the period, the more weight it adds to the price level analysis.
Developing Supply and Demand Crypto Strategy: Ultimate Considerations
To develop an ultimate crypto trading strategy, traders must implement methods that look for confluency along all the explained scenarios and techniques to identify key levels.
This strategy must be adaptable to different trading styles, such as scalping, day trading, swing trading, and long-term approaches. This is plausible since supply and demand are the fundamental forces moving the price of assets and shaping market structures.

In that sense, developing a supply and demand trading strategy can be boosted by additional technical analysis concepts such as chart patterns, candle patterns, and techniques like finding confluences among different indicators and time frames.
Let’s see how it works for distinct trading styles.
Scalping
This style requires rapid trade entries and exits at shorter time frames such as 3-minute, 2-minute, 1-minute, and tick charts. While using shorter time frames, spotting trends, momentum, and different market phases is easy but could be based on weak support and resistance.
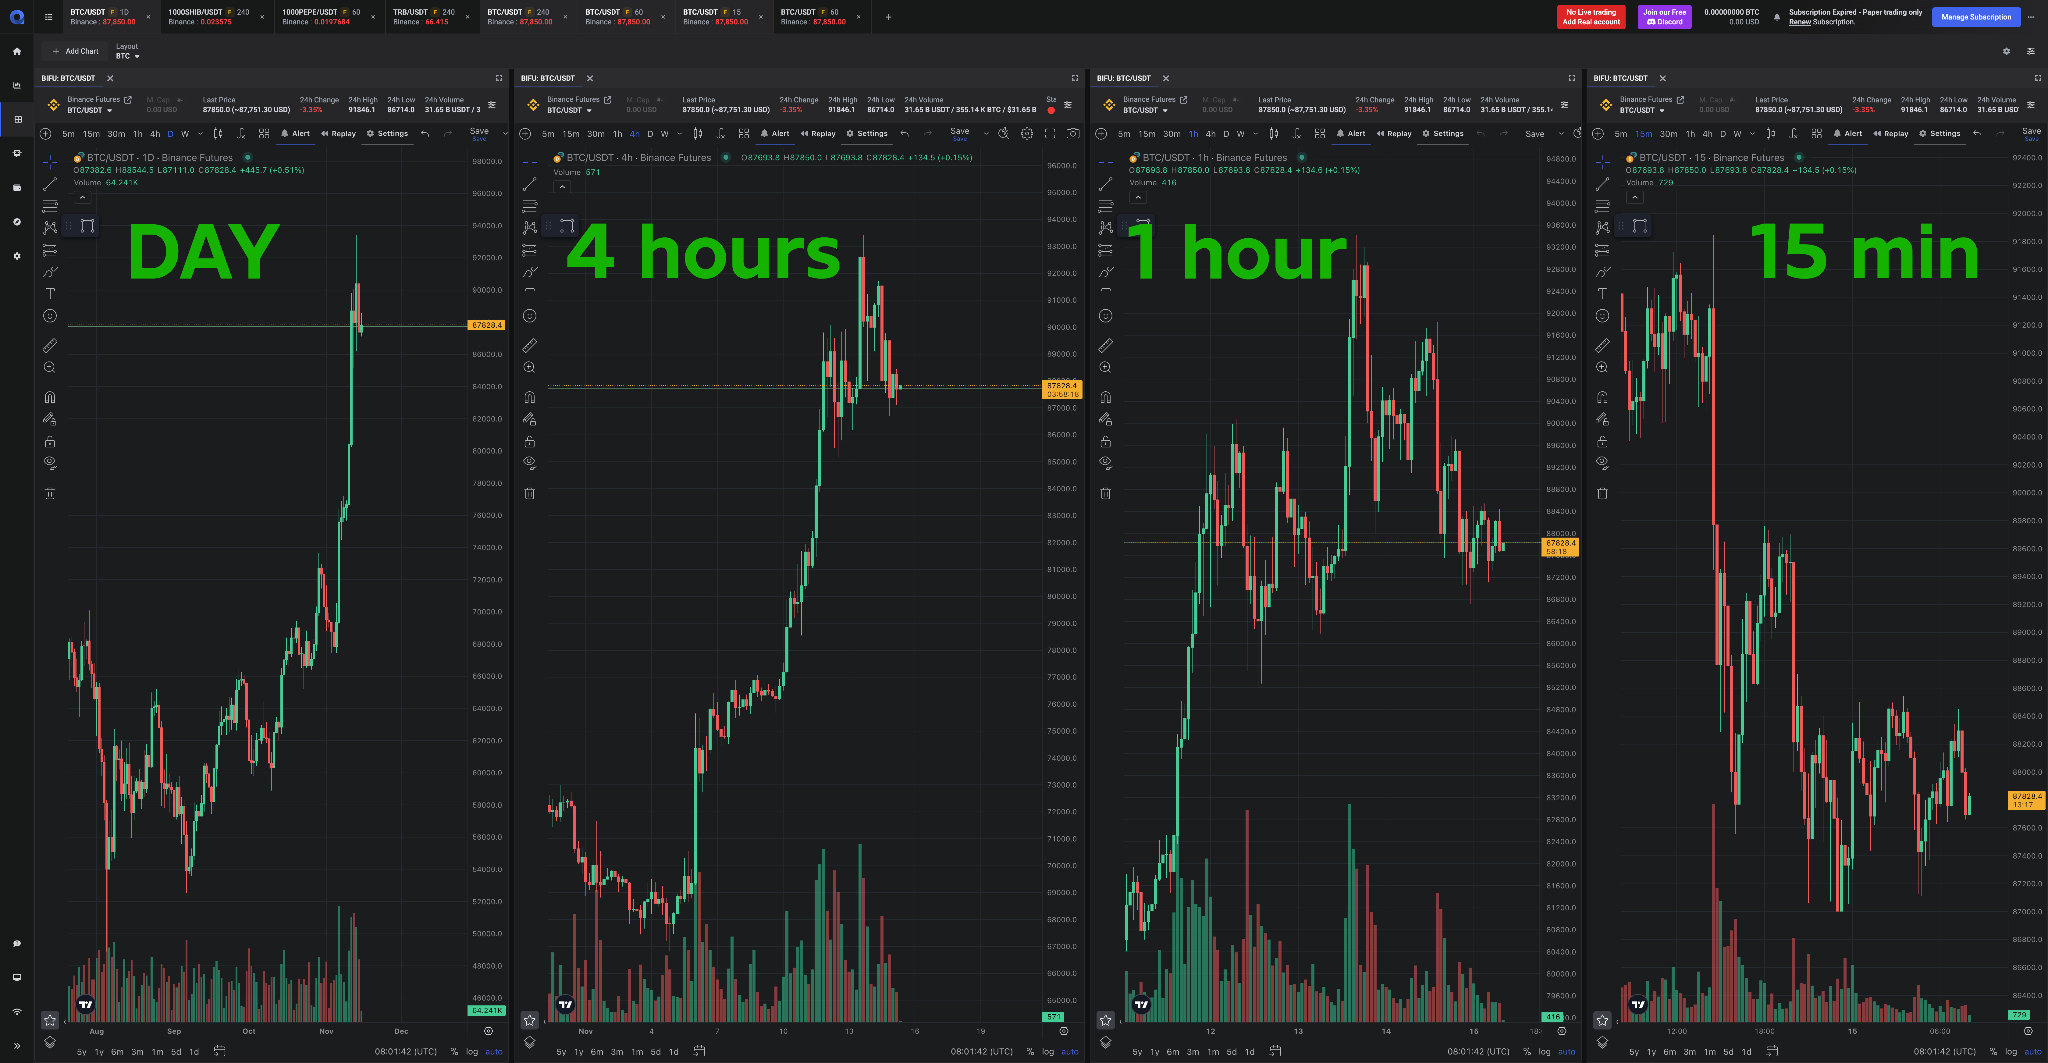
Supply and demand strategies for this style should consider confirming key levels throughout different time frames to boost the reliability of the signals. Also, scalpers generally use candle patterns as entry signals.
Scenarios for scalping strategies based on supply and demand include the following factors:
- Short-trends: Identifying at least two higher lows when the price trends up or lower highs when it trends down. Drawing a trendline around them to spot key prices.
- Breakouts: Detecting significant price action around a key level while it weakens could lead to an effective breakout.
Day trading
An example of day trading based on supply and demand finds a basis in news trading strategies. When a meaningful report about a crypto asset is released, it evokes a sentiment that drives most market participants to sell or buy quickly.
Generally, that noteworthy desire to acquire an asset persists during the day session and even days after, demarking key levels where the price is expected to bounce along a trend condition, being the most relevant price at the level at which the report was released.
Swing Trading
Seizing range conditions to identify key levels while implementing a swing trading strategy can be a reasonable approach for some essential reasons:
- Swing trading employs higher time frames such as 2-hour, 4-hour, 6-hour-
- Higher time frames give insights into more meaningful trading zones as they take longer to form.
- When the price reaches a key level at a higher timeframe, the odds for a price bounce are in its favor.
Likewise, looking for trends can be even more profitable as such an approach requires holding a position for days or weeks in a determined direction.
Finally, among all the previous styles and trading scenarios, using the Volume Indicator can be functional to supply and demand strategies to measure the zone strength.

Conclusion
Supply and demand are two paramount forces that reflect the desire of buyers and sellers to acquire or dispense with a determined asset. They reveal key price levels in crypto markets that help traders detect high-probability opportunities. This notion extends through scalping, day trading, and swing trading styles.
The post The Ultimate Crypto Trading Strategy for Consistent Profits: Supply and Demand Levels appeared first on New York Tech Media.
© 2025 Benzinga.com. Benzinga does not provide investment advice. All rights reserved.
Trade confidently with insights and alerts from analyst ratings, free reports and breaking news that affects the stocks you care about.