Your Exclusive Benzinga Insider Report
(DO NOT FORWARD)
By analyst Gianni Di Poce
Volume 3.50
Market Overview (Member Only)
- It was another split tape with the Nasdaq being the only index finishing in positive territory. It closed up 0.34% on the week, while the S&P 500 and Dow Jones Industrial Average finishing down 0.64% and 1.82%, respectively.
- Breakouts in the semiconductor space continued last week with Broadcom joining the trillion-dollar club. We need to see chips hit new highs.
- There was a major breakthrough in the quantum computing space last week with Alphabet's release of the Willow chip. Many Magnificent Seven names saw big rallies, which is not the worst sign for this market.
- Crypto is consolidating near the highs, which is bullish price action. I'm looking for more upside sooner rather than later.
Stocks I Like
Pan American Silver PAAS (53% Return Potential)

What's Happening
- Pan American Silver (PAAS) is a leading precious metals mining company, focused on the exploration, extraction, and production of silver and gold, with operations across the Americas.
- In 2023, the company reported revenues of $2.0 billion, with a net loss of $0.4 billion.
- Pan American Silver’s valuation is consistent with a major mining company. Its Price-to-Sales ratio is 2.2, yet it continues to generate substantial revenue despite facing industry-wide challenges.
- At a technical level, PAAS is consolidating within an ascending triangle formation, a continuation pattern. If it clears resistance, look for this stock to continue its multi-year bull trend.
Why It's Happening
- As economic uncertainties persist and inflation concerns linger, precious metals like silver and gold are likely to remain attractive safe-haven assets. PAAS, as a leading producer, stands to benefit from potential increases in metal prices. This market environment could drive higher revenues and profitability, potentially leading to significant stock price appreciation.
- Based on promising results, Pan American has raised its drilling budget to over 450,000 metres for 2024. This significant investment in exploration underscores the company’s commitment to organic growth and resource expansion.
- Pan American Silver received Investment Canada Act approval for the sale of its La Arena gold mine and La Arena II project in Peru to Zijin Mining Group. This deal, worth $245 million in cash plus royalties, demonstrates the company’s ability to optimize its portfolio and unlock value from non-core assets.
- Pan American Silver produced 5.47 million ounces of silver and 225,000 ounces of gold in Q3 2024. These strong production figures indicate the company’s operational efficiency and its ability to meet market demand.
- The company reported record revenue of $716.1 million in Q3 2024.
- Pan American Silver achieved remarkable financial results in Q3 2024, with record free cash flow of $151.5 million.
Analyst Ratings:
- Jeffries: Hold
- Scotiabank: Sector Outperform
- CIBC: Outperformer
My Action Plan (53% Return Potential)
- I am bullish on PAAS above $20.00-$21.00. My upside target is $34.00-$35.00.
GDS Holdings GDS (62% Return Potential)

What's Happening
- GDS Holdings (GDS) is a leading provider of high-performance data center solutions, offering colocation services, cloud infrastructure, and technology solutions primarily in China.
- In 2023, GDS reported revenue of $1.2 billion, with a net loss of $450 million.
- GDS's valuation reflects its position in the growing data center industry. The company has a Price-to-Sales ratio of 6.3 and continues to expand its infrastructure despite ongoing financial challenges. Their EV to EBITDA is at 43.07.
- From a technical perspective, GDS is coiling within an ascending triangle formation. If it clears resistance, I'll be looking for another leg higher in this name.
Why It's Happening
- GDS is well-positioned to benefit from the booming data center market in China and Southeast Asia. As a leading developer and operator of high-performance data centers in these regions, GDS stands to capture a significant share of this growing market, potentially leading to long-term stock appreciation.
- GDS International’s Series B equity raise was upsized to a whopping $1.2 billion, showcasing strong investor confidence. This substantial capital injection will accelerate GDS’s expansion plans, potentially leading to increased market share and revenue growth in the near future.
- The involvement of renowned investors like SoftBank Vision Fund and Citadel’s CEO Kenneth Griffin in the Series B raise adds significant credibility to GDS’s business model. Such high-profile backers could attract more institutional investors, potentially driving up the stock price.
- With the Series B proceeds, GDS expects to have sufficient equity to develop over 1 GW of total data center capacity. This massive expansion in capacity positions GDS to capitalize on the growing demand for data centers, potentially leading to substantial revenue growth in the coming years.
- The company’s gross profit margin improved significantly, reaching 22.2% in Q3 2024 compared to 17.8% in the same period last year.
- GDS’s international business is showing explosive growth, with net revenue increasing by 636.3% year-over-year to RMB363.2 million (US$51.8 million) in Q3 2024.
Analyst Ratings:
- RBC Capital: Outperform
- B of A Securities: Buy
- JP Morgan: Neutral
My Action Plan (62% Return Potential)
- I am bullish on GDS above $17.50-$18.00. My upside target is $34.00-$35.00.
D-Wave Quantum QBTS (80% Return Potential)

What's Happening
- D-Wave Quantum (QBTS) is a technology company focused on developing quantum computing solutions for various industries, aiming to solve complex computational problems that are beyond the capabilities of traditional computers.
- In 2023, the company reported revenue of $5.1 million, with a net loss of $12.3 million.
- D-Wave's valuation is steep a Price-to-Sales ratio of 20.2. The company is still in the early stages of commercialization and has yet to achieve profitability.
- From a charting perspective, QBTS established an incredible flag pole. If it starts to go sideways here, it may end up flagging and completing a bull flag formation. This could lead to much higher prices in time.
Why It's Happening
- D-Wave is the only player in the industry with a commercial quantum computing model, primarily through its annealing solution. This unique positioning sets D-Wave apart from competitors and provides a significant first-mover advantage in the commercial quantum computing space, potentially leading to increased market share and revenue growth.
- D-Wave has seen increasing interest from U.S. Department of Defense and other government agencies. This attention from high-profile organizations not only validates D-Wave’s technology but also opens up potentially lucrative government contracts.
- Wall Street analysts expect D-Wave’s revenue to reach $14.8 million in 2025, representing nearly 70% growth. This projected revenue increase suggests strong future demand for D-Wave’s quantum computing solutions and could drive significant stock appreciation as the company moves closer to profitability.
- D-Wave has broadened its customer base to 132 customers across commercial, government, and research sectors. The company saw a 66% increase in revenues from government customers and a 47% increase from research customers in Q3 2024.
- D-Wave’s Quantum Computing-as-a-Service revenues grew an impressive 41% year over year, reaching $1.6 million in Q3 2024.
Analyst Ratings:
- B. Riley Securities: Buy
- Needham: Buy
- Roth MKM: Buy
My Action Plan (80% Return Potential)
- I am bullish on QBTS above $3.75-$3.80. My upside target is $9.00-$10.00.
Market-Moving Catalysts for the Week Ahead
Inflation Stable, But Elevated
Last week's inflation report, Consumer Price Index (CPI) for November 2024, showed that the CPI increased by 0.3% on a seasonally adjusted basis in November, following a 0.2% rise for each of the previous four months.
Over the last 12 months, inflation increased by 2.7% before the seasonal adjustment. The shelter index rose by 0.3% and accounted for nearly 40% of the monthly increase in the all items index (so much for that housing crash).
We also saw the food index increased by 0.4%, with food at home up by 0.5% and food away from home by 0.3%. We're seeing a trend of inflation tick higher as well as some upward revisions. Later on in this report, we'll take a closer look at what the bond market thinks about inflation. This week, we have PCE inflation data, so that needs to be watched closely as well.
The "X" Factor for Government in 2025
I think one of the most consequential features of the incoming Trump administration is with the Department of Government Efficiency (DOGE). Elon Musk and Vivek Ramaswamy will be heading the project, and if the advisory body successfully identifies and reduces wasteful spending, it will contribute to a leaner federal budget, potentially lowering the deficit and freeing up resources for more productive investments or tax relief.
This could stimulate economic growth by increasing business and consumer confidence. However, the execution of such cuts, especially if they involve significant changes to government agencies or regulations, could also lead to short-term economic disruptions, particularly in sectors heavily reliant on government contracts or regulation.
The effectiveness of DOGE will ultimately depend on Congressional cooperation, as major structural changes require legislative action, and any perceived overreach or mismanagement could lead to political and economic backlash. It's going to be contentious.
A Deeper Look at the Yield Curve
The Federal Reserve is set to cut interest rates another 25-basis points this week, which will bring short-term rates back down to the 4.25-4.50% range. But the significance of this goes beyond rates itself and has a lot to do with the yield curve.
The yield curve can be compared across different timeframes or maturities, but perhaps the most consequential part of the curve that could change significantly next week has to do with the difference between the 3-month Treasury Bill and the 10-Year Treasury Note.
We're finally on the cusp of seeing the curve un-invert here after its longest time being inverted in history. Historically, a recession has occurred around such instances, but I think it already happened in 2022. Not to mention, we're in a secular bear market in bonds now, so I think the old rules need to be modified in this case.
Sector & Industry Strength (Member Only)

Markets have been chopping around over the past week, with the Nasdaq storming onto new all-time highs, while the Dow continues its mild correction. But if we take a closer look at how the market's sectors are doing since the start of Q2, this still looks like a tape where dips need to be bought.
The top-performing sector since the start of Q2 is still consumer discretionary (XLY), and it's by a wide-margin. This is not the type of leadership you'd see if the market was about to sell off precipitously.
Communications XLC are trading in second-place, followed by utilities XLU and financials XLF. I'd prefer to see XLU lower in the tape, but I think AI is changing the game on that front. Seeing energy XLE, healthcare XLV, and basic materials XLB near the bottom of the tape still signals that inflation has a lid on it for now.
| 1 week | 3 Weeks | 13 Weeks | 26 Weeks |
| Communications | Consumer Discretionary | Consumer Discretionary | Consumer Discretionary |
Editor's Note: Communications and consumers – not a bearish tape.
The Big Concern in Tech Land – Sector ETF SMH QQQ
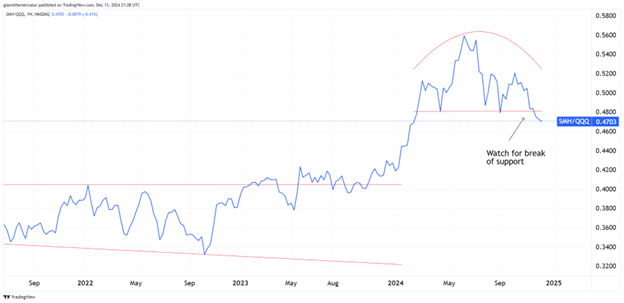
With the big breakthrough in the tech and chip land announced last week with Google's Willow quantum chip, I think it's a good time to bring the ratio between semiconductors (SMH) and the Nasdaq 100 (QQQ) back onto your radar.
I must admit – this market looks strong, but the underperformance of chips over the past few months is giving me some reservations. Here's the thing – without chips, the tech sector's advancements are impossible, so when they're underperforming against tech, it tells me that demand could be slowing.
My concern on this matter stems from the breakdown in the ratio from the rounding top formation. Granted, it could still be a false-breakdown, but if we see the ratio retest former-support-turned-resistance, and it forms a lower-high, it will be a major problem going forward regarding the state of this trend.

Another Chance for Metal Bulls – Sector ETF GLD SLV
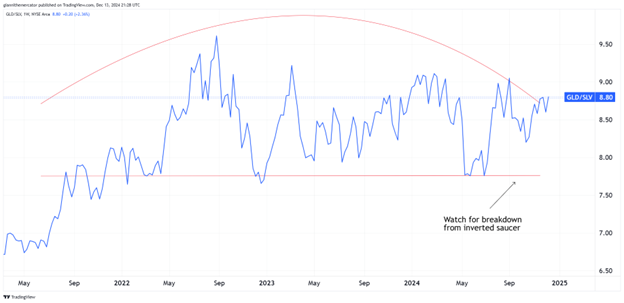
I'm really liking the price action in precious metals that we've seen over the past week, and as a result, it's a good time to check in on what's happening in the ratio between gold (GLD) and silver (SLV).
The big thing here is that in real bull markets for precious metals, I like to see silver (SLV) outperform gold (GLD) on a relative basis. For this ratio, it would mean that we want to see it decline. Note how over the past few weeks we had a corrective rally to the upside, where GLD outperformed SLV.
The big inverted saucer present on the chart below is what's really on my radar here in this ratio. If we see support break to the downside, then I wouldn't be surprised to see silver test its all-time highs from 2011 in the $48.00-$50.00 zone next year. For gold, I'm looking for it to rally to $3,300-$3,400 at least.

What's the Word With Inflation? – Sector ETF TIP IEF
Last week's CPI report came in at estimates and showed a 2.7% annual increase in prices. It showed a slight uptick, but this too was anticipated. If you've been reading the Benzinga Edge report for long enough, you'll already know that I care much more about what the bond market thinks about inflation than laggard economic data.
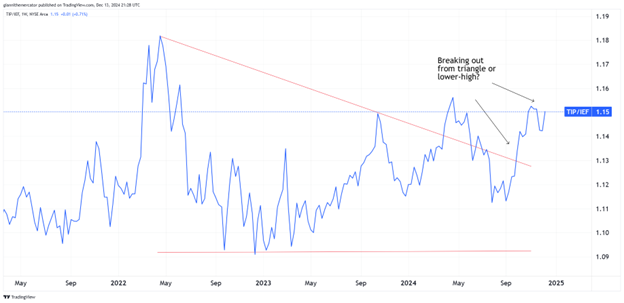
This means that we're back to looking at the ratio between Treasury Inflation Protected Securities (TIP) and 7-10 Year Treasuries (IEF). Whenever TIP outperforms IEF, it means that bonds are pricing in higher inflation, but whenever IEF outperforms TIP, it means that bonds are pricing in lower inflation.
This ratio chart shows a mixed trend in the near-term. Over the past couple of years, the trend is undoubtedly up, and in time, I do expect it to continue to the upside. It just depends on whether we can breakout decisively from the descending triangle formation.

Editor's Take:
There are a lot of economic changes take place at the moment, but the talk of the town now is for policymakers to try and grow our way out of the federal debt debacle. The thing to understand here is that higher economic growth will mean higher inflation in the long-run.
I think in the near-term, we have a goldilocks economic scenario coming with low inflation and solid economic growth. However, at some point, we will start to see the economy start to overheat, and the initial response from the Fed will probably be to raise rates.
In the meantime, keep a close eye on this ratio. I still think we have a setup for a disinflationary environment where energy prices drop hard at first, and then begin a prolonged rally. This ratio will give us a better sense of what the bond market is thinking on that front.
Cryptocurrency
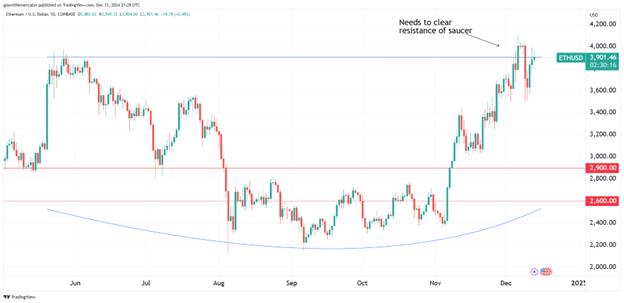
Going into 2025, Ethereum's technical picture is looking increasingly appetizing. The cryptocurrency has already confirmed its bull trend across all time horizons, yet it remains off its all-time high in the 4800-5000 zone.

Based on what I'm seeing on this chart above, that all-time high probably won't hold if prices break out from the saucer formation I'm watching. A close above 4,100-4,200 would be very bullish and likely lead to a surge as high as 5,400-5,600 at the least.
But my target for Ethereum is even higher than that. I think it's entirely within the realm of possibility that we see Ethereum rally as high as 8,000 next year. As long as it holds above 3,300-3,500, there's no reason to be bearish.
Legal Disclosures:
This communication is provided for information purposes only.
This communication has been prepared based upon information, including market prices, data and other information, from sources believed to be reliable, but Benzinga does not warrant its completeness or accuracy except with respect to any disclosures relative to Benzinga and/or its affiliates and an analyst’s involvement with any company (or security, other financial product or other asset class) that may be the subject of this communication. Any opinions and estimates constitute our judgment as of the date of this material and are subject to change without notice. Past performance is not indicative of future results. This communication is not intended as an offer or solicitation for the purchase or sale of any financial instrument. Benzinga does not provide individually tailored investment advice. Any opinions and recommendations herein do not take into account individual client circumstances, objectives, or needs and are not intended as recommendations of particular securities, financial instruments or strategies to particular clients. You must make your own independent decisions regarding any securities, financial instruments or strategies mentioned or related to the information herein. Periodic updates may be provided on companies, issuers or industries based on specific developments or announcements, market conditions or any other publicly available information. However, Benzinga may be restricted from updating information contained in this communication for regulatory or other reasons. Clients should contact analysts and execute transactions through a Benzinga subsidiary or affiliate in their home jurisdiction unless governing law permits otherwise.
This communication may not be redistributed or retransmitted, in whole or in part, or in any form or manner, without the express written consent of Benzinga. Any unauthorized use or disclosure is prohibited. Receipt and review of this information constitutes your agreement not to redistribute or retransmit the contents and information contained in this communication without first obtaining express permission from an authorized officer of Benzinga. Copyright 2022 Benzinga. All rights reserved.
© 2025 Benzinga.com. Benzinga does not provide investment advice. All rights reserved.
Trade confidently with insights and alerts from analyst ratings, free reports and breaking news that affects the stocks you care about.