Market Overview (Member Only)
- Volatility came back roaring with a vengeance last week, but the Nasdaq was down the least as it closed down 1.78%. The S&P 500 and Dow Jones Industrial Average were down more, finishing 1.99% and 2.25% lower, respectively.
- I'm seeing signals in the tape that most of the selloff is over, if not already.
- Fed Chair Powell spooked markets by coming off as very hawkish last week, although it looks like crude oil may come to the Fed's rescue.
- Markets close early at 1:00 PM Eastern on Tuesday and are closed completely on Wednesday for the Christmas holiday. Enjoy the break!
Stocks I Like
A10 Networks ATEN (51% Return Potential)

What's Happening
- A10 Networks (ATEN) is a leading provider of high-performance application delivery and cybersecurity solutions, specializing in helping businesses secure, accelerate, and optimize their networks.
- In 2023, the company reported revenues of $650 million, with a net profit of $80 million.
- A10 Networks’ valuation reflects its position as a key player in the network security and application delivery market. With a strong revenue base, its Price-to-Sales ratio is 5.1, while its P/E is at 29.09 and its EV to EBITDA is at 22.82.
- From a technical standpoint, ATEN is rising within a channel after breaking out from a saucer formation. As long as it stays within the channel, it's bullish.
Why It's Happening
- Security-focused revenue grew by 10% year-to-date, highlighting A10’s strong position in the rapidly expanding cybersecurity market. With cyber threats becoming increasingly sophisticated, demand for A10’s security solutions is likely to accelerate. This focus on security could be a key driver of future revenue growth and stock appreciation.
- 10 Networks has no outstanding debt, which is a significant advantage in the current rising interest rate environment. This debt-free status reduces financial risk and allows the company to allocate more resources towards growth initiatives and shareholder returns.
- Analysts maintain a bullish outlook on A10 Networks, with Sidoti analyst Anja Soderstrom reiterating a Buy rating and setting a price target of $25.00. This target represents significant upside potential from current levels.
- A10’s enterprise segment showed strong growth, increasing 5% year-to-date and 9% over the past 12 months.
- The company reported impressive Q3 2024 results, with revenue increasing 15.5% year-over-year to $66.72 million, surpassing analyst estimates of $63.78 million.
Analyst Ratings:
- BWS Financial: Buy
- Craig-Hallum: Buy
My Action Plan (51% Return Potential)
- I am bullish on ATEN above $16.50-$17.00. My upside target is $28.00-$29.00.
Alpha & Omega Semiconductor AOSL (80% Return Potential)
What's Happening
- Alpha and Omega Semiconductor (AOSL) is a leading global provider of power semiconductors, specializing in the design, development, and supply of a broad range of products, including power management and analog ICs.
- In 2023, the company reported revenues of $1.4 billion, with a net profit of $185 million.
- AOSL’s valuation aligns with its strong position in the semiconductor industry, boasting a Price-to-Sales ratio of 1.87. Its EV to EBITDA is at 27.08 too.
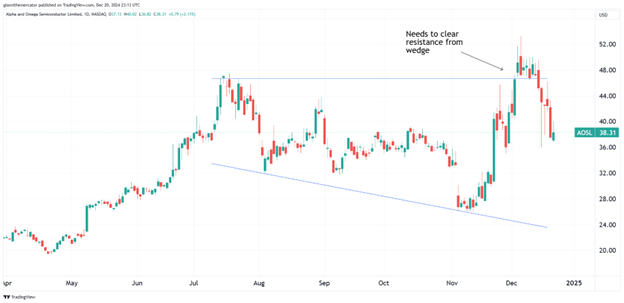
- At a technical level, AOSL is seeking a breakout from a broadening wedge formation. If successful, it could lead to an acceleration in upside momentum.
Why It's Happening
- Alpha and Omega Semiconductor (AOSL) is positioned for significant revenue growth in the coming quarters. With the increasing demand for semiconductor products in various sectors, including automotive, consumer electronics, and industrial applications, AOSL is well-placed to capitalize on these market trends.
- AOSL is actively expanding its presence in high-growth markets such as electric vehicles and advanced driver-assistance systems (ADAS). As these sectors continue to evolve and grow, AOSL’s specialized semiconductor solutions are likely to see increased demand, potentially driving substantial revenue growth.
- The company’s commitment to innovation in power management technologies positions it at the forefront of addressing critical challenges in energy efficiency. As global focus on sustainability intensifies, AOSL’s expertise in this area could lead to increased market share and higher profit margins.
- AOSL boasts a wide range of products, including Power MOSFETs, SiC, IGBTs, and various power management ICs. This diversification helps mitigate risks associated with market fluctuations in specific product categories and positions the company to capitalize on multiple growth avenues within the semiconductor industry.
- While AOSL currently faces a negative net margin, the company’s focus on high-growth sectors and innovative technologies presents opportunities for margin expansion. As the company scales its operations and potentially benefits from economies of scale, profitability could see significant improvement.
- With a price-to-sales (P/S) ratio of 2.1x, AOSL is trading at a significant discount compared to its industry peers. Nearly half of the companies in the U.S. Semiconductor industry have P/S ratios above 4x, with some even exceeding 10x. This low valuation presents an attractive entry point for investors seeking undervalued opportunities in the semiconductor space.
Analyst Ratings:
- Stifel: Sell
- Benchmark: Buy
- B. Riley Securities: Buy
My Action Plan (80% Return Potential)
- I am bullish on AOSL above $36.00-$37.00. My upside target is $69.00-$71.00.
F5 FFIV (43% Return Potential)
What's Happening
- F5 (FFIV) is a leading provider of application delivery and cybersecurity solutions, specializing in enabling businesses to secure, scale, and optimize their applications and networks.
- In 2023, the company reported revenues of $2.8 billion, with a net profit of $500 million.
- F5’s valuation reflects its prominent position in the application services market, with a Price-to-Sales ratio of 5.2. Their P/E is at 27.58, which isn't outrageous for a tech name, and the EV to EBITDA is at 18.87.
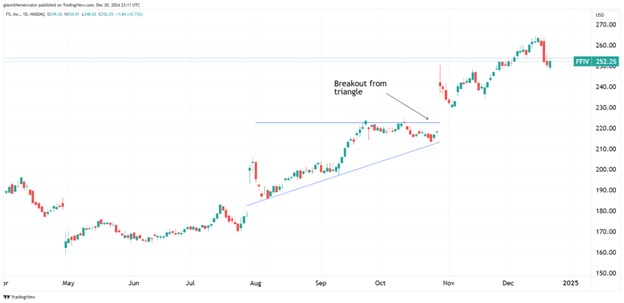
- From a charting standpoint, FFIV broke out from an ascending triangle pattern back in October and never looked back. The stock continues to trend higher, which is bullish.
Why It's Happening
- F5’s strategic partnership with MinIO is a game-changer for AI workloads. By combining MinIO’s high-performance object storage with F5’s traffic management and security technologies, the company is positioning itself at the forefront of AI infrastructure solutions.
- F5’s transformation from a hardware-centric company to a security and software leader is paying off. The company’s success in redefining its role beyond the data center has increased its value to customers and expanded its total addressable market. This strategic pivot positions F5 for sustained growth and could lead to higher valuations as investors recognize the company’s enhanced market position.
- The company’s recurring revenue is on the rise, now constituting 76% of total revenue at $2.1 billion. This shift towards a more predictable revenue stream enhances F5’s financial stability and makes it an attractive option for investors seeking consistent growth. The increasing proportion of recurring revenue could lead to a higher valuation multiple for the stock.
- The announcement of a new $1 billion stock repurchase program demonstrates management’s confidence in the company’s future and commitment to delivering shareholder value. This program could provide support for the stock price and signal to investors that the company views its shares as undervalued, potentially driving up demand.
- The company’s outlook for fiscal year 2025 is optimistic. F5 expects to deliver total revenue growth of 4% to 5% and non-GAAP earnings per share growth of 5% to 7%.
- With a 6% year-over-year increase in revenue to $747 million and a 19% surge in software revenue, F5 is demonstrating its ability to adapt and thrive in the evolving tech landscape.
Analyst Ratings:
- Goldman Sachs: Neutral
- JP Morgan: Neutral
- RBC Capital: Sector Perform
My Action Plan (43% Return Potential)
- I am bullish on FFIV above $220.00-$222.00. My upside target is $360.00-$365.00.
Market-Moving Catalysts for the Week Ahead
Powell Was Naughty for Santa
In Jerome Powell’s press conference last week, he announced that the Federal decided to lower the interest rate by 25 basis points to a range of 4.25% – 4.50%. This was in alignment with market estimates and marks a full percentage point reduction from the peak rate. While this was a dovish move, we saw long-term bonds still sold off.
Powell highlighted that with this change, the Fed can afford to be more cautious with future rate adjustments. He acknowledged that the decision to cut rates was a closer call, evidenced by one dissent among the committee members.
This cautious approach comes as the Fed believes it is closer to a neutral policy rate, suggesting a new phase in monetary policy where further adjustments will be considered more carefully. It seems the Fed is still concerned about inflation going into next year, but that narrative could shift again if the energy market breaks down.
The Dollar Conundrum
Amidst the market volatility last week, we saw the U.S. Dollar surge to new multi-year highs. It looks like we may see the Dollar even more to test or exceed its 2022 highs, and the question that follows is why?
I've gotten a lot of inquiries lately as to whether stocks and crypto can continue to rally if the Dollar does. The short answer is undoubtedly yes, but the reasons behind the Dollar rally must also be considered.
A lot of it has to do with the world wanting to participate in the U.S. economy and the hope of further growth. But there's also a safety element to it – much of the world is facing geopolitical turmoil, so part of it has to do with a flight-to-safety. To be clear – I'm not sure that the new administration will be able to accomplish all of its economic policy objectives with a strong Dollar. The market always has a mind of its own.
Full-Blown Holiday Markets are Upon Us
This tape reminds me a lot of the 2018 flash-crash. I was still working in the wealth management industry at the time. We had the longest government shutdown in history during that time, markets bottomed on December 24 and then proceeded to rip more than 10% in the following month.
This week, we'll have a shortened trading day on Tuesday and then markets will be closed on Wednesday in observance of Christmas. The following week, we'll have the markets only closed on New Years Day.
It's important to take some time away from the trading desk around this time. Remember that in many cases, less means more. In other words, you won't necessarily get better results watching every tick in the tape. That said, there is a lot of opportunity in this market right now.
Sector & Industry Strength (Member Only)
We finally saw some pronounced selling last week, and there's been a notable sentiment shift in markets, which I am welcoming going into 2025. If we look at the sector performance rankings compared to last week, we'll see that hardly anything has changed – this is a good sign.
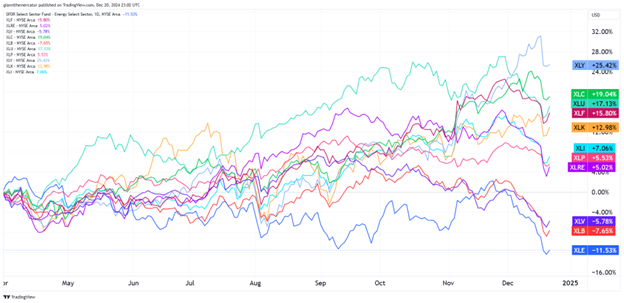
The more defensive sectors of the market like healthcare XLV and energy XLE are now in negative territory since the start of Q2. But in terms of leadership, we still see the risk-on sectors near the top of the leadership board.
So, is this a buy the dip scenario? I would say so, especially considering that consumer discretionary XLY is the top-performing sector still since the second quarter. I'd like to see some improvement from tech XLK and that could be possible coming out of a market bottom here soon.
| 1 week | 3 Weeks | 13 Weeks | 26 Weeks |
| Technology | Consumer Discretionary | Consumer Discretionary | Consumer Discretionary |
Editor's Note: Technology was down the least last week – it says a lot about a new potential leader.
The Quantum Leap in Tech – Sector ETF QTUM XLK
It seems like there has been a tremendous acceleration in technological developments over the past couple years. Artificial intelligence has been the big one as of late, but it's looking like the market has found a new darling in the quantum computing space.
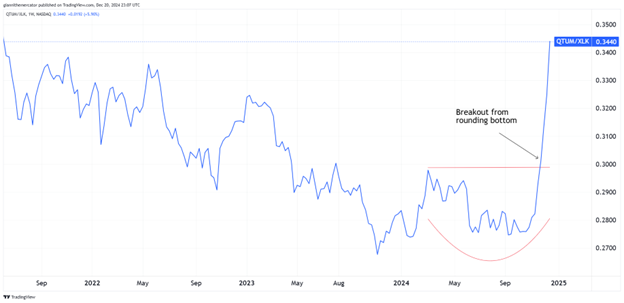
This chart takes a look at the ratio between the quantum computing sector (QTUM) and technology (XLK). We know that tech has dominated the rest of the market over the past few years, so seeing QTUM breakout of the rounding bottom formation on this chart speaks volumes of the opportunity here.
As long as we keep seeing higher-highs and higher-lows in this ratio, we need to take this quantum computing trend very seriously. With the recent surge, it wouldn't be unhealthy to see a pause in this rise, or even a slight decline. But for now, the market seems to be all-in on quantum mania.
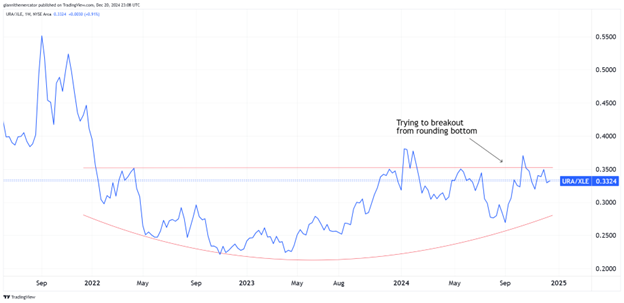
An Opportunity of Nuclear Proportions – Sector ETF URA XLE
Energy policy is going to take on a new level of importance with the incoming Trump Administration. The key to understand what could happen has to do with the supply-side of the market. It's not been popular to think about the supply side of markets for a couple decades, but 2020 reminded us of its importance.
I'm looking at the ratio here between uranium stocks (URA) and energy stocks (XLE). It the new administration turns on the oil spigots, or negotiates some sort of peace deal overseas, it could temporarily send oil prices lower.
As I look at this rounding bottom formation in this ratio, it seems to be like there's a lot more opportunity in the nuclear space compared to energy. Much of this probably has to do with A.I. data centers, but now we also have to add energy demand for quantum computing into the mix. Right now, there's only one reliable source of potent energy like that, and it's nuclear.
The "Junk" is Still Strong – Sector ETF HYG TLT
While there are some mounting concerns about what is going down in the bond market, and for good reason, I'm pleased to report some positive news to readers, and it has to do with spreads between junk bonds (HYG) and long-term Treasuries (TLT).
Here you have two different types of bonds on the complete opposite of the risk spectrum. HYG tends to trade like a stock, while long-term Treasuries (TLT) are the market's most-defensive asset – they tend to do well when things are heading south.
When it comes to this ratio, we would normally look for a major breakdown in this ratio to the downside. This would be a signal that liquidity conditions are deteriorating. Fortunately for bulls, the opposite has occurred – it's holding up well.

Editor's Take:
Instead of suffering a major breakdown, it looks like this ratio is about to breakout from an ascending triangle formation. This implies that it could continue its trend higher. I'll be straight up with you and say that the likelihood of a major market calamity occurring with junk bonds outperforming Treasuries like this simply isn't very high.
It also signals that there remains an appetite for risk in the bond market. This is important because the bond market is mostly dominated by institutions and is considered to be where the smart money plays.
The Fed also knows to watch spreads like this. It's why every few weeks, we cycle through the various types of spreads in the bond market to help us gauge risk from a credit standpoint. I think we're in a dip-buying environment if this is the case.
Cryptocurrency
Based on the Ripple chart, we’re witnessing a serious technical setup that deserves attention. A bullish flag pattern has been forming since early December, following XRP’s explosive move from the $0.60 level to nearly $2.80. This is a powerful momentum pattern, marked by parallel downward-sloping trendlines. Explosive rallies often follow.
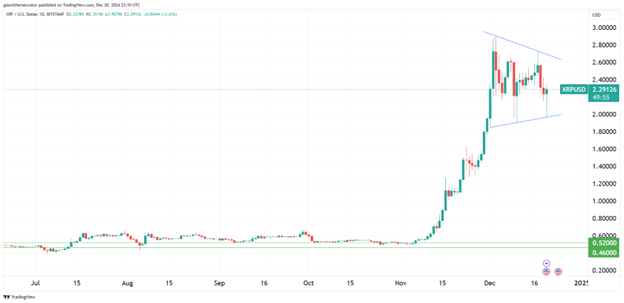
The price action has been particularly encouraging, with XRP maintaining support above the $2.40 level despite several tests. More importantly, the consolidation is occurring after a significant breakout from a long-term base that formed between July and November 2024. The measured move from this flag pattern, if it breaks to the upside, could potentially target the $3.00-3.20 range.
The fact that XRP is holding these elevated levels with relatively low volatility suggests accumulation rather than distribution. However, bulls need to see a decisive break above the upper trendline of the flag, ideally accompanied by an uptick in volume, to confirm the pattern’s validity and trigger the next leg higher.
Legal Disclosures:
This communication is provided for information purposes only.
This communication has been prepared based upon information, including market prices, data and other information, from sources believed to be reliable, but Benzinga does not warrant its completeness or accuracy except with respect to any disclosures relative to Benzinga and/or its affiliates and an analyst’s involvement with any company (or security, other financial product or other asset class) that may be the subject of this communication. Any opinions and estimates constitute our judgment as of the date of this material and are subject to change without notice. Past performance is not indicative of future results. This communication is not intended as an offer or solicitation for the purchase or sale of any financial instrument. Benzinga does not provide individually tailored investment advice. Any opinions and recommendations herein do not take into account individual client circumstances, objectives, or needs and are not intended as recommendations of particular securities, financial instruments or strategies to particular clients. You must make your own independent decisions regarding any securities, financial instruments or strategies mentioned or related to the information herein. Periodic updates may be provided on companies, issuers or industries based on specific developments or announcements, market conditions or any other publicly available information. However, Benzinga may be restricted from updating information contained in this communication for regulatory or other reasons. Clients should contact analysts and execute transactions through a Benzinga subsidiary or affiliate in their home jurisdiction unless governing law permits otherwise.
This communication may not be redistributed or retransmitted, in whole or in part, or in any form or manner, without the express written consent of Benzinga. Any unauthorized use or disclosure is prohibited. Receipt and review of this information constitutes your agreement not to redistribute or retransmit the contents and information contained in this communication without first obtaining express permission from an authorized officer of Benzinga. Copyright 2022 Benzinga. All rights reserved.
© 2025 Benzinga.com. Benzinga does not provide investment advice. All rights reserved.
Trade confidently with insights and alerts from analyst ratings, free reports and breaking news that affects the stocks you care about.