

Your Exclusive Benzinga Insider Report
(DO NOT FORWARD)
Market Overview (Member Only)
- It was a wild week for stocks, which likely bottomed last Monday. The Dow Jones Industrial Average led the rebound higher, closing up 3.69% on the week. The Nasdaq finished 2.45% higher, while the S&P 500 moved up 2.91%.
- Inflation came in soft, and we had strong earnings from banks, which sent financial soaring – the tape is still bullish.
- A new chapter begins in U.S. economic history with Donald Trump assuming the presidency on Monday. Stocks had a good run under Joe Biden save for the 2022 bear market.
- Markets are closed on Monday in observance of Martin Luther King Jr. Day.
Stocks I Like
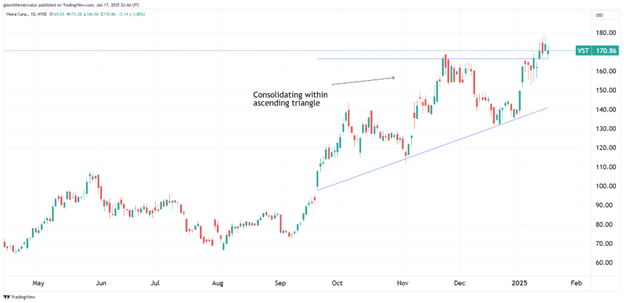
Vistra Corp. VST (+23% Return Potential)
What's Happening
- Vistra Corporation (VST) is a leading integrated power company that provides electricity and related services in the U.S., primarily through its retail and wholesale businesses.
- Over the past year, VST brought in $6.29 billion in revenue along with $1.84 billion in earnings.
- The valuation in this stock is slightly elevated. Its P/E is at 30.53, its Price-to-Sales is at 3.56, and its EV to EBITDA is at 11.90.
- At a technical level, VST is shaping up nicely within an ascending triangle formation. These are continuation patterns, and if it clears resistance, look for some more upside.
Why It's Happening
- Vistra has recently connected two large utility solar projects in Illinois to the grid, demonstrating its commitment to renewable energy expansion. These projects not only diversify Vistra’s energy portfolio but also cater to the increasing consumer and regulatory demand for clean energy, potentially leading to improved market perception and stock performance.
- The company has extended the operations of its 1,185-MW Baldwin Power Plant through 2027, addressing reliability concerns in the MISO market. This strategic decision balances the need for stable power supply with the transition to renewables, showcasing Vistra’s adaptability and foresight in managing its asset portfolio for optimal returns.
- Seaport Global analysts have raised Vistra’s price target to $200 from $155, a significant 29% increase. This bullish revision suggests that industry experts see substantial upside potential in Vistra’s stock, which could attract more investors and drive the share price higher.
- The appointment of Rob Walters as an independent director adds valuable expertise in power industry and regulatory affairs to Vistra’s board. This strategic addition to the leadership team could improve decision-making and help navigate complex regulatory landscapes, potentially leading to more favorable business outcomes and increased investor confidence.
- The Texas segment contributed an impressive $722 million in Adjusted EBITDA, highlighting Vistra’s dominant position in one of the largest energy markets in the United States. With Texas’s growing population and increasing energy demands, Vistra is well-positioned to capitalize on this lucrative market, potentially leading to sustained revenue growth.
- Vistra’s Q3 2024 financial results show impressive growth, with Net Income from Ongoing Operations soaring to $1,855 million from $519 million year-over-year.
Analyst Ratings:
- UBS: Buy
- Morgan Stanley: Overweight
- BMO Capital: Outperform
My Action Plan (23% Return Potential)
- I am bullish on VST above $140.00-$142.00. My upside target is $210.00-$220.00.
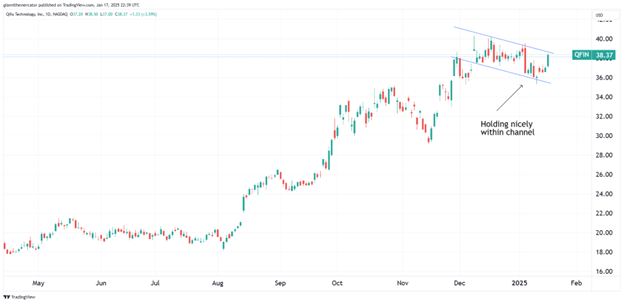
Qifu Technology QFIN (+75% Return Potential)
What's Happening
- Qifu Technology (QFIN) is a leading provider of digital financial services in China, specializing in offering personal loans, credit scoring, and other financial products through its online platform.
- In the last year, QFIN brought in $4.16 billion in revenue as well as $1.38 billion in earnings.
- QFIN is very much an on-sale stock. Its P/E is just 7.54, and its Price-to-Sales is at 2.94. Its Book Value is 20.06 too.
- From a technical standpoint, QFIN is trying to breakout from a descending channel, a continuation pattern. If it makes a new high, expect a continuation of the bull trend.
Why It's Happening
- The company’s platform has connected a staggering 254.3 million consumers with potential credit needs as of September 30, 2024, representing an 11.6% increase from the previous year. This substantial growth in user base not only showcases Qifu’s market penetration but also indicates a vast potential for future revenue growth.
- Qifu’s platform has connected 162 financial institutional partners. This extensive network provides the company with a strong foundation for growth and diversification of its loan products. The continued expansion of partnerships is likely to result in increased loan volumes and revenues, potentially driving stock prices higher as the market recognizes Qifu’s growing market influence.
- Management has provided an optimistic outlook for Q4 2024, projecting non-GAAP net income between RMB1.80 billion and RMB1.90 billion, representing a year-on-year growth of 57% to 65%. This strong guidance reflects the company’s confidence in its business model and growth strategies. As Qifu delivers on these projections, it’s likely to drive investor confidence and potentially lead to stock price appreciation.
- Qifu Technology has announced a new $450 million share repurchase plan for 2025. This significant commitment to buying back shares demonstrates management’s confidence in the company’s future prospects and undervalued stock price.
- Qifu Technology reported significant enhancements in asset quality, with the Day-1 delinquency rate decreasing by 0.2 percentage points and the 30-day collection rate improving by 1.1 percentage points. These improvements reflect the company’s robust risk management capabilities and are likely to instill greater confidence among investors, potentially driving up stock prices as the market recognizes Qifu’s stability and reliability.
- Qifu Technology achieved unprecedented profitability, with non-GAAP net income soaring to RMB1.83 billion, marking a 29.1% year-over-year increase.
Analyst Ratings:
- Citigroup: Buy
- B of A Securities: Buy
- Morgan Stanley: Overweight
My Action Plan (75% Return Potential)
- I am bullish on QFIN above $32.00-$33.00. My upside target is $67.00-$68.00.
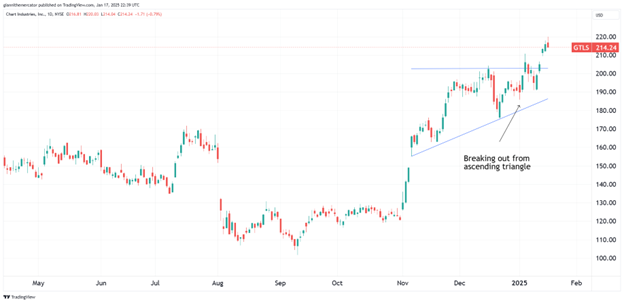
Chart Industries GTLS (+58% Return Potential)
What's Happening
- Chart Industries (GTLS) is a leading manufacturer of cryogenic equipment, providing solutions for the production, storage, and distribution of liquefied gases, including LNG, hydrogen, and oxygen.
- GTLS had $1.06 billion in revenue over the past year, along with $62.2 million in earnings.
- The valuation in GTLS is fairly elevated. Its P/E is at 56.56, its Price-to-Sales is at 2.47, and its EV to EBITDA is at 14.32.
- From a charting angle, GTLS is breaking out from an ascending triangle formation. This implies that a continuation of the bull trend is underway.
Why It's Happening
- Chart Industries is at the forefront of the clean energy transition. With its innovative cryogenic equipment for LNG and industrial gases, GTLS is perfectly positioned to capitalize on the global shift towards cleaner energy sources. As countries worldwide intensify their efforts to reduce carbon emissions, Chart’s technologies will see increasing demand, potentially driving significant revenue growth in the coming years.
- Chart’s proprietary IPSMR® liquefaction technology has been selected for major projects, including Woodside Energy’s Louisiana LNG development. This cutting-edge technology provides Chart with a competitive edge in the LNG market. As more companies adopt this efficient solution, Chart could see increased orders and revenue growth, potentially boosting its stock price.
- Chart’s recent agreement with ExxonMobil for the Mozambique Rovuma Venture showcases the company’s growing international presence. As Chart continues to secure contracts in diverse geographical locations, it reduces its dependence on any single market and opens up new growth opportunities.
- Chart is prioritizing debt reduction, aiming to bring its net leverage below 2.5 and reduce debt to $3 billion by the end of 2025. This prudent financial management strategy will strengthen the company’s balance sheet, potentially leading to improved credit ratings and lower borrowing costs. As Chart progresses towards these goals, it could attract more conservative investors and drive up demand for the stock.
- In Q3 2024, Chart achieved a record reported gross profit margin of 34.1% and adjusted operating margin of 22.2%.
- Chart generated $174.6 million in free cash flow during Q3 2024. This strong cash generation ability provides the company with financial flexibility to invest in growth initiatives, reduce debt, and potentially return value to shareholders through dividends or share buybacks.
Analyst Ratings:
- Stifel: Buy
- Goldman Sachs: Neutral
- BTIG: Buy
My Action Plan (58% Return Potential)
- I am bullish on GTLS above $180.00-$181.00. My upside target is $340.00-$350.00.
Market-Moving Catalysts for the Week Ahead
Quiet on Data, But Loud on Earnings
For the past couple of weeks, traders were inundated with key economic data on both the employment and inflation fronts. And to be frank, both of those data bits support the idea that the Fed could continue with their easing this year despite Powell's verbiage back in December.
If you thought that it would be just a regular trading week without headline risk, don't forget that earnings are at the top of the agenda now. We've seen some promising results from banks so far, and while some issued some dire warnings surrounding the economy, I'm fairly optimistic about the results of others to come.
Keep in mind that earnings surprising to the upside is a good thing when it comes to stock market valuations. If earnings exceed expectations, then all of those warnings around the stock market's P/E ratios don't become as dire – not that it's a good timing indicator to begin with.
Changing of the Guard in Washington
On Monday, Donald Trump will be sworn in as the 47th president of the United States. If we look back at the market over the past four years under Joe Biden's presidency, we can state that it was indeed a good one for markets.
Yes, we had a bear market in 2022, and it was actually the longest one since the Global Financial Crisis of 2008-2009. But let's not forget we also had a market crash in March of 2020 under Trump as well.
I always like to remind people to never let politics get involved with your portfolio. Ultimately, we're in the market for one reason, and on reason only: to make money. I think it's great to have ideas on how to improve the world, but the truth is, your portfolio is not the place to make that happen. So, as we enter a new chapter in American history, be sure to focus on the only thing that matters in trading and investing price action.
Sector & Industry Strength (Member Only)
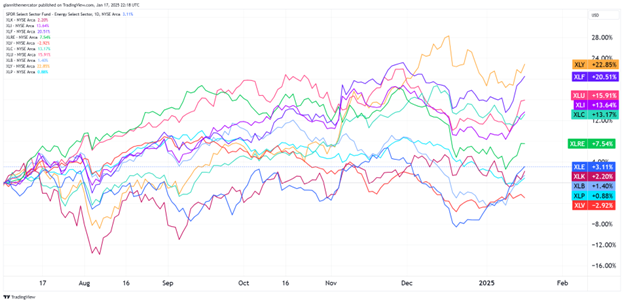
Over the past few weeks, I've been adamant about the nature of the sector flows in this market still being bullish. In other words, we've yet to see a meaningful inflow towards the market's defensive sectors. This would include consumer staples (Ticker: XLP), healthcare (Ticker: XLV), and energy (Ticker: XLE).
In fact, if we look at how the sectors stack up against one another going back to the start of Q3 2024, we see all of the defensive-oriented ones near the bottom. I do take issue, however, with technology (Ticker: XLK) being so low near the bottom. But I do think that will change sooner than later.
If we look at the market leaders, the best signal for bulls right now is how consumer discretionary (Ticker: XLY) continues to lead. This is not the type of sector that would be leading if markets were about to roll over. Same goes for financials (Ticker: XLF). Utilities (Ticker: XLU) aren't the strongest signal, but artificial intelligence could be changing the game in that sector.
| 1 week | 3 Weeks | 13 Weeks | 26 Weeks |
| Financials | Energy | Consumer Discretionary | Consumer Discretionary |
Editor's Note: Financials responding well to big earnings beats and leading the way higher doesn't seem bearish to me.
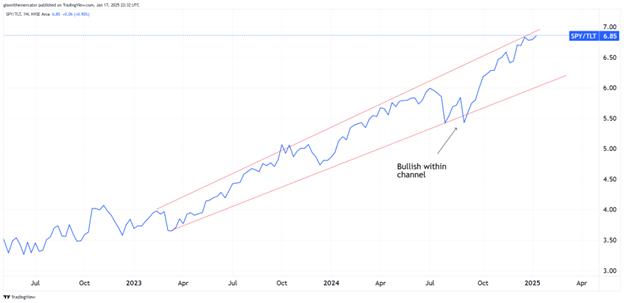
Stock-Bond Ratio Continues Climb Higher – Sector ETF: SPY TLT
After last week's inflation reports, it's a good time to check back in on the market's classical risk-on/risk-off indicator – the ratio between stocks (SPY) and long-term Treasuries (TLT). This is especially pertinent this week since we saw a nice rally in bonds following Wednesday's inflation report.
Stocks are considered to be the riskier asset compared to bonds, so when SPY outperforms TLT, or this ratio is rising, it's a risk-on signal for the broader market. A recent exception to this rule was the 2022 bear market. But when TLT outperforms SPY, it's a cautionary signal.
For now, we keep seeing higher-highs and higher-lows in this ratio. As long as it remains within the ascending channel formation, it's a good time to continue owning stocks, and owning very little, if any, bonds.
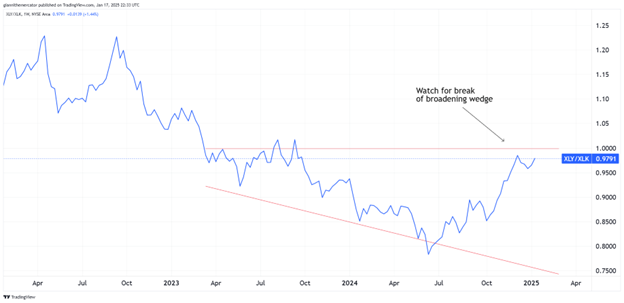
How Strong is the Consumer? Sector ETF: XLY XLK
I want to mix it up a little bit this week and compare two growth-oriented sectors to see which one could be set to be the leader in 2025. In this chart below, we're looking at the ratio between consumer discretionary (XLY) against technology (XLK).
We know that technology is the largest and most important sector in the overall stock market, but let's not forget that the consumer drives the U.S. economy (consumption accounts for ~70% of U.S. GDP). So, it's important to see both sectors do well.
But our goal is to generate alpha and outperform. Since June, retail stocks have done much better than tech, but the longer-term trend in this ratio is downward, and favors tech notably. However, if we see a break above resistance of the broadening wedge formation, the consumer may end up being even stronger than expected.
The Chance for Credit Spreads – Sector ETF: LQD IEI
When I say there is an absolutely tremendous development taking place in the bond market, especially when it comes to credit spreads, I'm not exaggerating. Over the past few months, there's been a slight deterioration in liquidity conditions, which has contributed to recent volatility.
If we take a look at the ratio chart below, which measures credit spreads between investment-grade corporate debt (LQD) and 3-7 Year Treasuries (IEI), we see that there's the potential for a temporary bottom now. And even more importantly, it's coming in the form of a higher-low.
Bigger picture, we've been watching the rounding bottom formation on this chart for several months now. If we clear the upper horizontal trendline acting as resistance, it would be a monumental development when it comes to liquidity conditions.
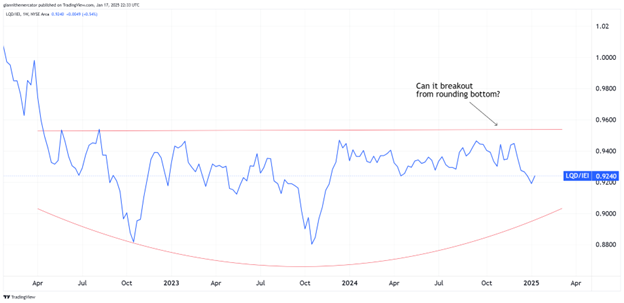
Editor's Take:
Remember, when this ratio rises, it implies that liquidity conditions are improving. You may see corrections unfold in market environments flush with liquidity, but typically, they are very slow, boring, and drawn out.
On the contrary, when you see credit spreads blow out, or this ratio that we look at here crash, then it opens the door for those "no bid," gap-down style markets. Obviously, those are no fun to be caught up in.
It all comes down to the Principle of Interconnectivity and understanding that all markets are connected. In other words, what's happening in bonds will impact currencies, stocks, commodities, and vice versa.
Cryptocurrency
Bitcoin’s price action has reached a critical technical juncture that could lead to the next leg higher in prices. A breakout from a rectangle pattern, which is a continuation pattern, could be underway that takes prices up to the 115,000-120,000 area quickly.
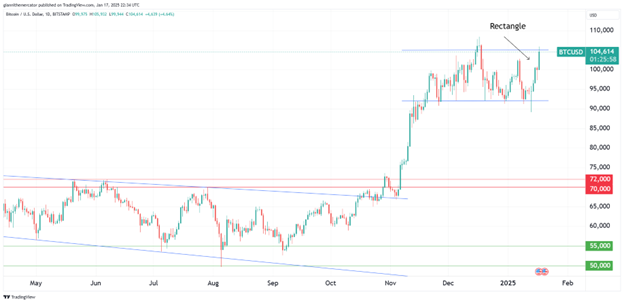
The trend remains solidly in the camp of the bulls, as another higher-low was confirmed with respect to the trend on January 13. The key now is for a new all-time high to follow, which would reinforce the trend in favor of the bulls.
There's also a new solid support zone that was confirmed during the latest pullback, which was 90,000-92,000. As long as Bitcoin holds above there, only a healthy level of skepticism is warranted in terms of the bull trend.
Legal Disclosures:
This communication is provided for information purposes only.
This communication has been prepared based upon information, including market prices, data and other information, from sources believed to be reliable, but Benzinga does not warrant its completeness or accuracy except with respect to any disclosures relative to Benzinga and/or its affiliates and an analyst’s involvement with any company (or security, other financial product or other asset class) that may be the subject of this communication. Any opinions and estimates constitute our judgment as of the date of this material and are subject to change without notice. Past performance is not indicative of future results. This communication is not intended as an offer or solicitation for the purchase or sale of any financial instrument. Benzinga does not provide individually tailored investment advice. Any opinions and recommendations herein do not take into account individual client circumstances, objectives, or needs and are not intended as recommendations of particular securities, financial instruments or strategies to particular clients. You must make your own independent decisions regarding any securities, financial instruments or strategies mentioned or related to the information herein. Periodic updates may be provided on companies, issuers or industries based on specific developments or announcements, market conditions or any other publicly available information. However, Benzinga may be restricted from updating information contained in this communication for regulatory or other reasons. Clients should contact analysts and execute transactions through a Benzinga subsidiary or affiliate in their home jurisdiction unless governing law permits otherwise.
This communication may not be redistributed or retransmitted, in whole or in part, or in any form or manner, without the express written consent of Benzinga. Any unauthorized use or disclosure is prohibited. Receipt and review of this information constitutes your agreement not to redistribute or retransmit the contents and information contained in this communication without first obtaining express permission from an authorized officer of Benzinga. Copyright 2022 Benzinga. All rights reserved.
© 2025 Benzinga.com. Benzinga does not provide investment advice. All rights reserved.
Trade confidently with insights and alerts from analyst ratings, free reports and breaking news that affects the stocks you care about.

