Your Exclusive Benzinga Insider Report
(DO NOT FORWARD)
By analyst Gianni Di Poce
Volume 4.05
Market Overview (Member Only)
- Stocks wrapped up a turbulent week but finished mixed. The Nasdaq and S&P 500 were both down 1.64% and 1.00%, respectively, while the Dow Jones Industrial Average bucked the trend and closed up 0.27%.
- Headline risks are elevated with respect to intraday volatility, but the trend in stocks remains up.
- Chinese artificial intelligence shook tech names earlier in the week, while tariff announcements led to some turbulence going into the weekend.
- Gold hit a new all-time high, while Bitcoin continues to consolidate near its record high. Both silver and Ethereum could be coming alive soon.
Stocks I Like
JD.com JD (+47% Return Potential)
What's Happening
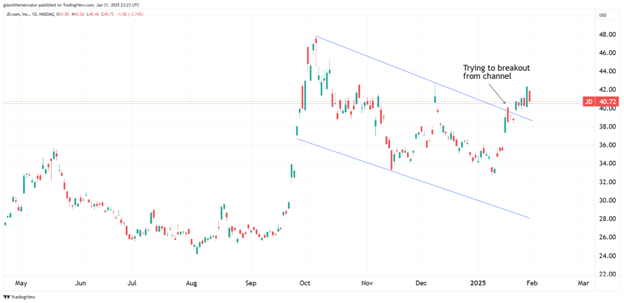
- JD.com (JD) is a leading e-commerce and technology company in China, specializing in online retail, supply chain, and logistics services. The company is focused on providing a seamless shopping experience, offering a wide range of products from electronics to apparel, while also expanding into cloud computing and artificial intelligence.
- JD.com brought in over $260 million in revenue over the past year, while also notching $11.73 billion in earnings.
- This valuation on this stock is very attractive. Its P/E is at 12.97, its Price-to-Sales is at 0.40, and its EV to EBITDA is at 7.99.
- From a technical perspective, JD is seeking a breakout from a descending price channel. This could lead to a continuation of the uptrend in the near-term.
Why It's Happening
- The Chinese government has extended the “trade-in” policy in 2025, covering a wider range of product categories. JD.com is positioned as a key online beneficiary of this policy, which could significantly boost sales across various product lines. This government support provides a tailwind for JD’s growth strategy and could lead to increased revenue and profitability in the coming year.
- JD.com has completed its takeover of Dada Nexus with a privatization bid, increasing its stake to 100%5. This strategic move allows JD to fully integrate Dada’s intra-city delivery capabilities, potentially enhancing its logistics network and last-mile delivery services. The improved efficiency and expanded service offerings could lead to cost savings and revenue growth, positively impacting JD’s bottom line.
- The company's innovative offline shopping destinations, JD MALL and JD E-Space are revolutionizing the retail experience in eleven Chinese cities. By seamlessly integrating online and offline shopping, JD is creating a unique omnichannel experience that could drive customer loyalty and increase sales.
- JD.com’s Europe-based omni-channel retail brand, ochama, is expanding its product offerings and introducing competitive pricing strategies. This move could help JD capture market share in the European market and diversify its revenue streams.
- The company’s earnings per share (EPS) grew by 51% during the last year, outpacing even its strong share price growth. This substantial earnings growth demonstrates JD’s ability to improve profitability and operational efficiency.
- JD.com’s Q4 2024 results are expected to be solid, with total revenue and adjusted EBIT projected to rise 9% and 23% YoY respectively.
Analyst Ratings:
- Bernstein: Outperform
- Citigroup: Buy
- Benchmark: Buy
My Action Plan (47% Return Potential)
- I am bullish on JD above $34.00-$35.00. My upside target is $60.00-$62.00.
Alamos Gold AGI (+53% Return Potential)
What's Happening
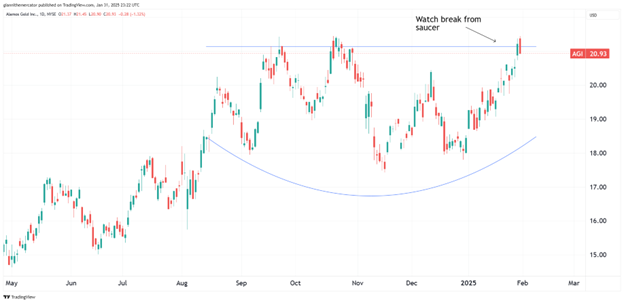
- Alamos Gold (AGI) is a Canadian-based intermediate gold producer with a focus on the acquisition, exploration, development, and operation of gold-bearing properties in North America, Latin America, and other markets worldwide. The company is committed to sustainable mining practices and operates a portfolio of low-cost, high-quality gold assets.
- The company generated over $360 million in revenue over the past year, plus $84.5 million in earnings.
- AGI's valuation is a bit steep. Its P/E is at 33.56, its Price-to-Sales is at 6.72, and its EV to EBITDA is at 13.77.
- From a technical standpoint, AGI is seeking a breakout from a saucer formation, which could lead to an acceleration in upside momentum.
Why It's Happening
- Alamos Gold achieved a record 567,000 ounces of gold production in 2024, marking a 7% increase from 2023. This impressive growth demonstrates the company’s operational efficiency and sets a strong foundation for future performance.
- The company forecasts a 24% increase in production by 2027, with 2025 guidance ranging between 580,000 and 630,000 ounces. This substantial growth trajectory positions Alamos as one of the fastest-growing gold producers in the sector.
- The integration of the Magino mine, acquired in July 2024, has boosted production guidance by over 20% for 2025-2026. This acquisition enhances Alamos’ growth profile and is expected to drive significant synergies.
- Ongoing drilling at the Island Gold Mine continues to extend high-grade gold mineralization, with expectations of another year of growth in Mineral Reserves and Resources. This exploration success could significantly increase the company’s long-term production potential.
- The company has announced a construction decision on the Lynn Lake project in Manitoba, which is expected to provide additional low-cost growth starting in 2028. This new development further strengthens Alamos’ long-term production pipeline.
- With record revenues of $1.3 billion in 2024 and a strong average realized gold price of $2,379 per ounce, Alamos is capitalizing on favorable market conditions. This financial performance is likely to translate into increased profitability and shareholder value.
Analyst Ratings:
- Jeffries: Buy
- Scotiabank: Sector Outperform
- RBC Capital: Outperform
My Action Plan (53% Return Potential)
- I am bullish on AGIabove $15.50-$16.00. My upside target is $32.00-$33.00.
Serve Robotics SERV (+86% Return Potential)
What's Happening
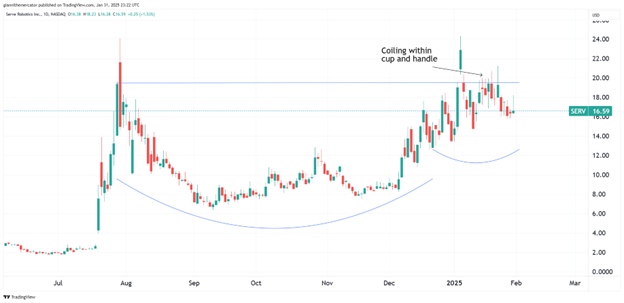
- Serve Robotics (SERV) is a cutting-edge robotics company focused on developing autonomous delivery solutions. The company specializes in deploying small, electric robots designed to safely and efficiently deliver food and goods in urban environments, enhancing last-mile delivery services while reducing carbon emissions.
- The company only had $221k in revenue since it went public and has lost around $8 million.
- It's hard to value a company like this, but the prospects are there. Its Book Value is just 1.09, but we've seen the futuristic theme playing out in markets.
- From a charting angle, SERV is building a beautiful cup and handle base that could lead to an explosion higher in prices.
Why It's Happening
- The last-mile delivery market, which Serve Robotics targets, is projected to be worth $450 billion annually by 2030. With its focus on autonomous delivery robots, Serve is well-positioned to capitalize on this booming sector. The company’s ability to reduce delivery costs to an estimated $1 per trip could disrupt traditional delivery models and attract major partnerships.
- Serve Robotics has secured strategic partnerships with major players like Uber and Eats 7-Eleven. Uber’s investment of $11.5 million highlights its confidence in Serve’s technology, while these collaborations provide Serve with a steady stream of deployment opportunities for its robots.
- Serve Robotics raised $86 million in December 2024 and an additional $80 million through a direct stock offering in January 2025. These funds extend the company’s operational runway through 2026, enabling it to self-fund equipment investments and avoid costly financing options.
- Institutional confidence in Serve Robotics is evident, with firms like NVIDIA and Delivery Hero investing in the company. NVIDIA's $12 million stake not only validates Serve’s AI-driven technology but also boosts its credibility among other potential investors.
- Analysts from Ladenburg Thalmann and Seaport Global Securities have given SERV a “Buy” rating, citing substantial revenue growth prospects tied to its fleet expansion and technological advancements. This positive sentiment could drive further investor interest.
- Serve Robotics achieved a 97% year-over-year increase in active robot operations as of late 2024, with each robot completing an average of 465 daily deliveries. These metrics reflect growing demand for its services and operational efficiency improvements.
- SERV has a short interest of around 17%, making it ripe for a modest squeeze.
Analyst Ratings:
- Northland Capital Markets: Outperform
- Ladenburg Thalmann: Buy
My Action Plan (86% Return Potential)
- I am bullish on SERV above $14.00-$14.50. My upside target is $31.00-$32.00.
Market-Moving Catalysts for the Week Ahead
The Fed is Just Buying Time
The Fed did their best to not rock the ship last week, and I think they were largely successful in doing so. Rates didn't move, and Fed Chair Powell said the Fed was in no rush to cut rates again in the near-term.
Then we had the GDP data that came in below estimates. If anything, this gives the Fed another bit of data to resume rate cuts, and in all likelihood, the next cut will come sometime either in June or July.
This week, we have key employment data, and I must admit, this is a growing area of concern for me. We're seeing the complete restructuring of the federal government right now, and that includes major government job loss. But when it comes to Fed moves, an uptick in unemployment would push for them to cut interest rates sooner and more aggressively.
What's a Dollar to Do?
When it comes to markets, we must remember which one is at the top of the financial pyramid, and that's currencies. And on top of the currency pyramid is the U.S. Dollar. Since September, we've seen the Dollar index soar in value together with stocks. This tells us something very important.
Basically, the world's money, or as I like to call it, "Global Capital," is fighting to get into U.S. markets – whatever the cost. I've been talking about the possibility of a pause in the Dollar's rally, but if anything, it would only be temporary.
I think a strong Dollar will be a major impediment to the Trump administration's economic policies. The truth is, markets don't care what you want them to do – you can't impose your will upon it. Unless the world wants to adopt a more growth-oriented economic policy, there may be nothing that can be done.
Sector & Industry Strength (Member Only)
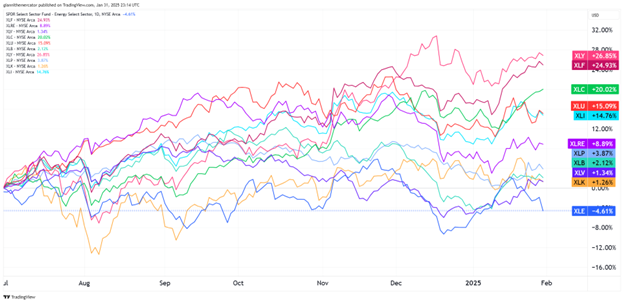
That's a wrap for January, and after a couple of bouts of volatility this month, we're able to take full stock of the situation going back to the start of Q3 2024. And the good news is that the money flows within the market are still pointing to bulls having the advantage going into February.
For the sake of the bulls, it's a hard sell to say the market is about to roll over when you have consumer discretionary (Ticker: XLY), financials (Ticker: XLF), and communications (Ticker: XLC) as the top-performing sectors in the market.
Energy (Ticker: XLE) remains at the bottom and is the only sector with negative returns since the start of Q3. Healthcare (Ticker: XLV), another defensive sector, is still struggling. I'm still keen on a tech (Ticker: XLK) rebound, and I'll share which sector I think can take the initiative below.
| 1 week | 3 Weeks | 13 Weeks | 26 Weeks |
| Communications | Materials | Consumer Discretionary | Consumer Discretionary |
Editor's Note: Only Materials popped into the leaderboard this week. Everything else is the same, which is bullish.
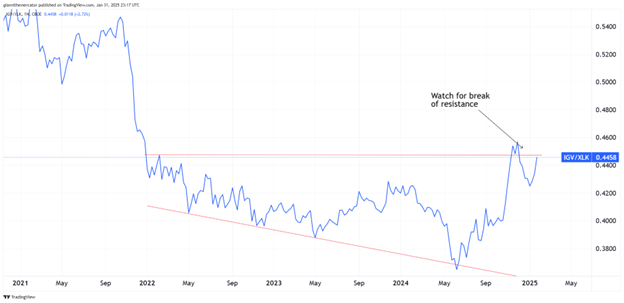
The New Tech Theme – Sector ETF IGV XLK
The recent A.I. developments out of China with DeepSeek have changed the game in the tech space, and this could lead to massive shifts in investment dollar allocation going forward. So this week, we're breaking down the tech sector further to see if there could be a new theme emerging in the space.
Let's start by looking at the ratio between software (IGV) and the broader tech sector (XLK). For a few years now, we've seen money siphoned away from software and into artificial intelligence investments. The theme has dominated the tech space. But we saw this ratio bottom back in June 2024.
It slowly trended higher, but then made a notable pop in November, and followed shortly thereafter with a higher-low. Now it's trying to breakout from a broadening bottom pattern, and if successful, expect software to become the new theme in the tech space.
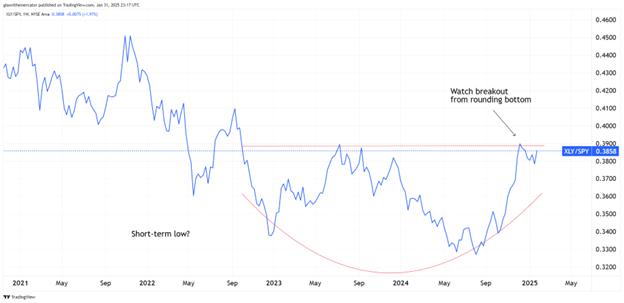
What if the Consumer Outperforms in 2025? Sector ETF XLY SPY
I periodically like to remind readers that in markets, sentiment follows price, not the other way around. But there are even rare occasions where sentiment is completely disconnected from reality, and in this case, it has to do with the state of the consumer.
Most of the news that we keep hearing about has to do with how dark the situation is for the consumer. But what does the market have to say about this? After all, the consumer discretionary sector has been one of the best performing sectors in the S&P over the past 6 months.
We're looking at the ratio between consumer discretionary (XLY) against the S&P 500 (SPY). The ratio turned a big corner in August 2024, just before the Fed cut rates. It's now about to breakout from a rounding bottom pattern, which would all but secure an uptrend here. Perhaps the market has more confidence in the consumer than the economic reports do. Who do you want to believe?
Measuring Money Flows in Bonds (Sector ETF: Ticker: BIL) TLT
The developments unfolding in the bond market right now are absolutely critical and are going to drive stock market returns (or lack thereof) significantly in the coming months. Contrary to what Powell alluded to last week, the Fed has won a major battle against inflation, but the war is far from over.
But that means that tactical moves can be made in the bond market. We're looking at the ratio between short-term Treasury Bills (BIL) and long-term Treasury Bonds (TLT). Basically, when the ratio rises, you'd want to own short-term bonds, but if the ratio is dropping, you'd be better off owning long-term bonds.
Another way to look at this ratio is that when inflationary pressures are rising, the only way to preserve money in bonds is by holding short-term debt. In other words, this ratio rising does indicate inflationary pressures. If it's falling, then it means inflation is under control, and long-term bonds are able to outperform. Remember – long-term Treasuries are the most sensitive to fluctuations in inflation expectations.
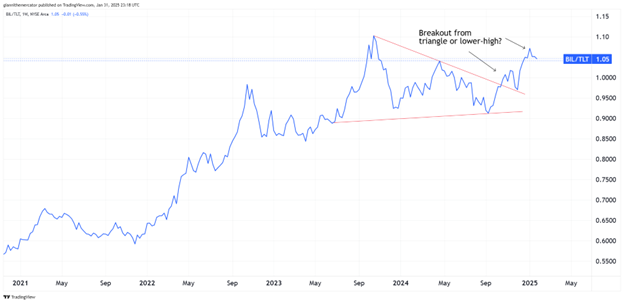
Editor's Take:
There was a major breakout from the symmetrical triangle pattern back in October, which was shortly after the Fed started cutting rates. Remember, rate cuts mean money is being printed again, and most often, triangle patterns lead to continuations in trend.
This matters because the trend in this ratio has been upward. Long-term Treasury markets have been decimated, but short-term T-Bills have offered some of the most attractive yields in recent memory.
Bond bulls will want to see a lower-high form in this ratio, for it would mean that long-term bonds are about to embark on a nice rally this year. It would also mean liquidity conditions improve, and it would also help some of the most important sectors in stocks, like tech and consumer discretionary, as they tend to do better with falling rates.
Cryptocurrency
Bitcoin continues to trade is a sideways price action near its all-time highs, which is generally considered to be bullish. We keep seeing higher-highs and higher-lows, which is confirms it is still in a bull trend.
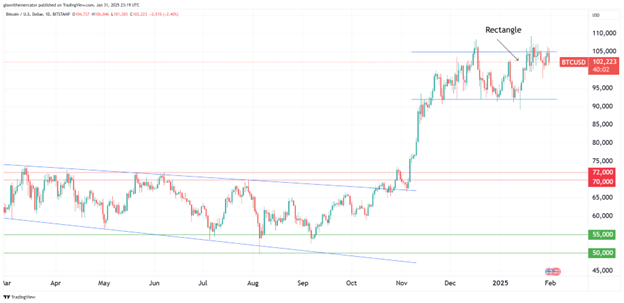
The fact that Bitcoin has largely maintained prices above $100,000 during this consolidation phase demonstrates impressive strength, especially considering the magnitude of the advance from November’s levels.
Looking ahead, a decisive break above the $105,552 resistance level could trigger a significant move higher, with the first targets in the $112,000-115,000 range. The methodical nature of this consolidation, coupled with the strong base built above six figures, provides a solid foundation for the next potential leg higher. As long as it stays above 88,000-90,000, it looks good.
Legal Disclosures:
This communication is provided for information purposes only.
This communication has been prepared based upon information, including market prices, data and other information, from sources believed to be reliable, but Benzinga does not warrant its completeness or accuracy except with respect to any disclosures relative to Benzinga and/or its affiliates and an analyst’s involvement with any company (or security, other financial product or other asset class) that may be the subject of this communication. Any opinions and estimates constitute our judgment as of the date of this material and are subject to change without notice. Past performance is not indicative of future results. This communication is not intended as an offer or solicitation for the purchase or sale of any financial instrument. Benzinga does not provide individually tailored investment advice. Any opinions and recommendations herein do not take into account individual client circumstances, objectives, or needs and are not intended as recommendations of particular securities, financial instruments or strategies to particular clients. You must make your own independent decisions regarding any securities, financial instruments or strategies mentioned or related to the information herein. Periodic updates may be provided on companies, issuers or industries based on specific developments or announcements, market conditions or any other publicly available information. However, Benzinga may be restricted from updating information contained in this communication for regulatory or other reasons. Clients should contact analysts and execute transactions through a Benzinga subsidiary or affiliate in their home jurisdiction unless governing law permits otherwise.
This communication may not be redistributed or retransmitted, in whole or in part, or in any form or manner, without the express written consent of Benzinga. Any unauthorized use or disclosure is prohibited. Receipt and review of this information constitutes your agreement not to redistribute or retransmit the contents and information contained in this communication without first obtaining express permission from an authorized officer of Benzinga. Copyright 2022 Benzinga. All rights reserved.
© 2025 Benzinga.com. Benzinga does not provide investment advice. All rights reserved.
Trade confidently with insights and alerts from analyst ratings, free reports and breaking news that affects the stocks you care about.

