Your Exclusive Benzinga Insider Report
(DO NOT FORWARD)
By analyst Gianni Di Poce
Volume 4.06
Market Overview (Member Only)
- Stocks were mostly lower after another choppy week filled with tariff tantrums. The S&P 500 was 0.24% lower along with the Nasdaq, which finished 0.53% lower. The Dow Jonest Industrial Average dropped 0.54%.
- Gold hit a new all-time high again, while cryptos are coming into this week playing some defense.
- Don't be shy to look abroad in this tape – especially Chinese markets.
- Software within tech still looks strong.
Stocks I Like
MicroStrategy MSTR 83% Return Potential
What's Happening
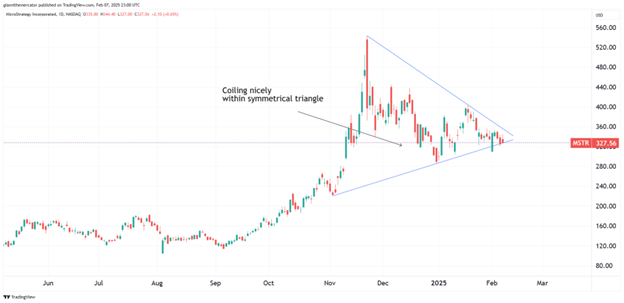
- MicroStrategy (MSTR) is a prominent business intelligence and analytics firm, specializing in data-driven solutions, enterprise software, and cloud-based platforms. The company also integrates artificial intelligence and blockchain technology in its services, along with purchasing a lot of Bitcoin.
- Over the past year, MSTR had $116.07 million in revenue, but still lost $340.17 million on the year.
- This valuation on MSTR is sky-high, largely due to the level of risk they're taking on selling bonds to buy Bitcoin. Their Price-to-Sales is at 143.99, while Book Value is just 14.95.
- From a technical standpoint, MSTR is coiling up nicely within a symmetrical triangle formation. This could lead to a continuation of its bull trend.
Why It's Happening
- MicroStrategy holds over 471,107 BTC, worth ~$18 billion as of October 2024, and continues buying via capital raises like its recent $563 million preferred stock offering. As Bitcoin adoption grows, MSTR's stock remains a leveraged play on BTC's price appreciation, attracting crypto-forward investors.
- The company's 8% Series A Perpetual Preferred Stock issuance (priced at $80/share) raised $563 million, earmarked for expanding BTC holdings. This aligns with its ambitious “21/21” plan to raise $42 billion over three years, combining equity and debt to amplify Bitcoin exposure.
- Analysts unanimously rate MSTR a Strong Buy, with a $557.50 average price target (66.5% upside). Mizuho's $515 target and TipRanks' bullish outlook highlight confidence in its Bitcoin-centric strategy.
- Despite tariff-induced market chaos, digital asset products saw $527 million in inflows recently. As institutional interest rebounds, MSTR stands to benefit disproportionately due to its Bitcoin-heavy balance sheet.
- MSTR offers traditional investors regulated exposure to Bitcoin's price movements without direct crypto ownership. With BTC ETFs facing regulatory scrutiny, MSTR remains a preferred vehicle for institutional capital.
- MSTR trades at a 30% discount to its Bitcoin holdings' value, per analysts. Closing this gap alone could propel shares to $550+, excluding upside from BI software growth or BTC price rallies.
Analyst Ratings:
- Mizuho: Outperform
- Benchmark: Buy
- Bernstein: Outperform
My Action Plan (83% Return Potential)
- I am bullish on MSTRabove $295.00-$300.00. My upside target is $600.00-$620.00.
Shopify SHOP 45% Return Potential
What's Happening
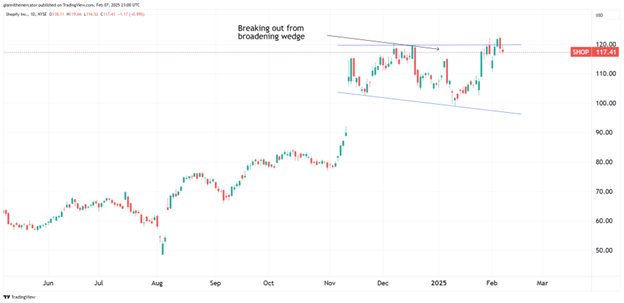
- Shopify (SHOP) is a leading e-commerce platform that helps businesses create and manage online stores, offering tools for design, payments, and inventory management. The company also explores fulfillment services and AI to support merchant growth.
- In the last year, SHOP had $828 million in revenue as well as $2.16 billion in earnings.
- SHOP has a sky-high valuation. Its P/E is at 106.9, its Price-to-Sales is at 18.25, and its EV to EBITDA is at 154.46. It will be key whether it can start delivering on earnings here.
- From a technical perspective, SHOP is starting to breakout from a broadening wedge formation. This could lead to an acceleration in upside momentum.
Why It's Happening
- Shopify's integration of AI-driven tools for personalized marketing, inventory management, and checkout optimization is attracting more merchants. These innovations could drive higher merchant retention and platform adoption.
- The enterprise-focused Shopify Plus platform is gaining traction with large retailers, offering scalability and customization. This segment's growth diversifies revenue and reduces reliance on small businesses.
- Global e-commerce is projected to grow at a 9.5% CAGR through 2030. Shopify's 10%+ market share in U.S. retail e-commerce positions it to outpace industry growth.
- Despite a 150% rally since 2022, SHOP trades at a PEG ratio of 2.46, below historical averages. Growth acceleration could justify multiple expansion. Shopify combines disruptive tech, financial discipline, and sector tailwinds, making it a standout pick for investors targeting the digital commerce revolution. With catalysts like AI adoption and earnings momentum, SHOP is positioned to outperform peers over the next 12–24 months
- Free cash flow margin hit 19% last quarter, up from 12% in 2023. Robust cash generation supports reinvestment in growth initiatives and potential shareholder returns.
- Shopify posted $2.2B in Q3 2024 revenue, marking a 26.1% YoY jump and its sixth consecutive quarter of >25% growth. This consistency underscores its scalable business model and ability to capture e-commerce tailwinds.
Analyst Ratings:
- RBC Capital: Outperform
- Wedbush: Outperform
- JMP Securities: Market Outperform
My Action Plan (45% Return Potential)
- I am bullish on SHOPabove $102.00-$105.00. My upside target is $170.00-$172.00.
Adtran Holdings ADTN 44% Return Potential

What's Happening
- ADTRAN (ADTN) is a telecommunications company that provides innovative networking solutions, specializing in broadband access, fiber optics, and 5G technologies. It enables service providers to deliver high-speed internet and connectivity services to customers.
- The company made $227.7 million over the past year, and suffered a net loss of around $31.2 million.
- It's hard to value a company that's losing money. But from a Price-to-Sales standpoint, which is just 0.89, it's hard to argue it's expensive. Its Book Value, however, is just 2.70.
- From a charting standpoint, ADTN is bullish so long as it remains within the ascending price channel, which signals a continuation of trend.
Why It's Happening
- The ESTU module's defense applications open access to $700M+ in annual U.S. military communication contracts. Recent DoD supply chain audits favor domestic providers like ADTRAN. This combination of institutional support, product innovation, margin expansion potential, and sector tailwinds creates asymmetric upside for patient investors. The February 24 earnings report could serve as the next catalyst for upward revisions.
- ADTRAN's new Enhanced Short-Term Unit (ESTU) timing module enhances synchronization accuracy for defense, space, and metrology applications. This positions ADTRAN to capture high-margin contracts in mission-critical sectors, directly boosting revenue diversification
- Five brokerages unanimously rate ADTN as a “Buy” or “Strong Buy,” with a $12.75 average price target (21% upside from $10.65). Rosenblatt Securities recently raised its target to $15 (41% upside), citing confidence in ADTRAN's broadband infrastructure growth
- Geode Capital, Barclays, and State Street increased stakes by 3.7%-11.4% in Q3 2024. Institutions now own 80.56% of shares, signaling strong conviction in ADTRAN's long-term restructuring potential.
- As telecom operators accelerate fiber/5G deployments, ADTRAN's OSC-52v3 timing solution becomes critical for network synchronization – a $1.2B TAM opportunity through 2027.
- Q4 2024 revenue guidance of $230M-$245M (vs. $225.48M in Q4 2023) reflects 5.1% YoY growth despite telecom sector headwinds. Analysts project full-year 2025 revenue of $1.15B, up 8% from 2024.
Analyst Ratings:
- Northland Capital Markets: Outperform
- Ladenburg Thalmann: Buy
My Action Plan (44% Return Potential)
- I am bullish on ADTNabove $9.00-$9.50. My upside target is $16.00-$17.00.
Market-Moving Catalysts for the Week Ahead
Think Beyond the Headlines
Call it the Trump Tape or the Tariff Tantrums, but we're seeing a new type of market take shape in 2025. It's largely characterized by tremendous intraday volatility, but what's interesting is that if you zoom out and look at the charts from a long enough timeframe, nothing has really changed.
Going into this week, we have key inflation numbers. CPI is back on the table, and you best believe the Fed is watching this closely as they try to talk their way around keeping the next rate cut pushed back until June or July.
To be fair, I don't think people give the Fed enough credit for actually listening to the market. I think it's largely for show that they pretend to use backward-looking economic data to make decisions on rate policy.
The Cost Has Never Been Higher to Ignore Price
I want to elaborate more on what I just shared above. Recently, I've heard stories of many traders blowing up their accounts just from intraday moves. To be clear – there's a big difference between gambling and speculating. We don't gamble – we speculate.
If you're getting caught on intraday volatility, and you find yourself stopping yourself out of positions before your stop losses hit because you're feeling overwhelmed from the dollar amount of losses, it's generally a good idea to dial back on your position sizing.
Remember, if you can't win small, you're not going to win big. Time in the market matters more than timing the market, but timing the market is how you outperform. Don't let the naysayers fool you into believing it can't be done. It just takes a lot more effort than dollar-cost averaging into an index fund.
Sector & Industry Strength (Member Only)
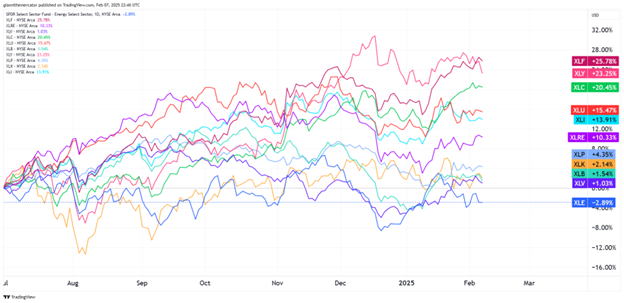
There's been some shifts in the tape this past week, and the good news is that none of it is really bearish. Do you think we'd be on the verge of a financial meltdown if financials (Ticker: XLF), of all sectors, are the best performer since the start of Q3 2024?
In second and third place, we have consumer discretionary (Ticker: XLY) and communications (Ticker: XLC), respectively. Neither of these are bearish. Healthcare (Ticker: XLV) has been making a comeback year-to-date, but bigger picture, it's still very weak.
It's also interesting to me how real estate (Ticker: XLRE) has quietly held its own despite deteriorating some in the past few months. I'm also pleased to see utilities (Ticker: XLU) dropping in the rankings, but still waiting for tech (Ticker: XLK) to rebound. I think it can.
| 1 week | 3 Weeks | 13 Weeks | 26 Weeks |
| Real Estate | Communications | Consumer Discretionary | Consumer Discretionary |
Editor's Note: Real estate and communications popping onto the scoreboard is not bearish price action.
Time to Look Abroad? Sector ETF: SPY VT
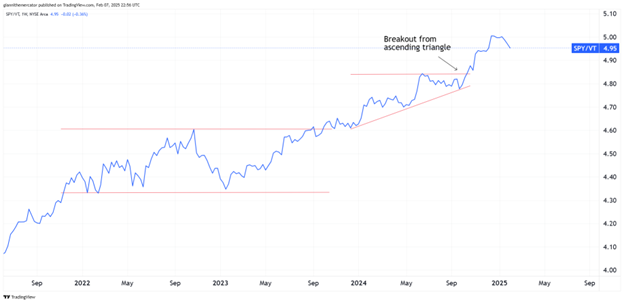
Many of us that live and trade U.S. markets have been spoiled over the past several years. It's been that long since we had to pay any significant attention to what's going on abroad in terms of equity markets.
I've already been adamant about the importance of China being on your radar, but it seems that the international theme goes beyond that. This week, we're looking at U.S stocks (SPY) versus global stocks (VT).
The ratio has been in a very strong and clean uptrend for years, which means that the best opportunities have been domestic. But let's not forget that financial markets are very much global, and this year, if your goal is to outperform the benchmark, you may have an easier time doing so by putting some money to work abroad.
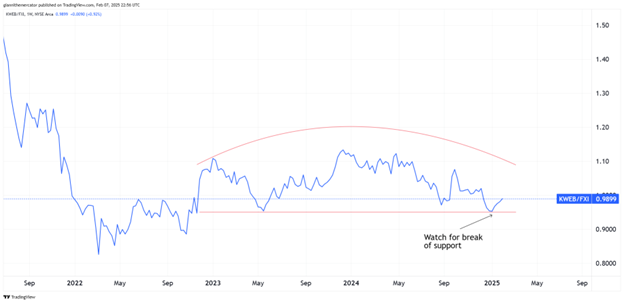
A Closer Look at China Sector ETF: KWEB FXI
When it comes to outperformance, it starts with owning the strongest country. The strongest sector in that country comes next. Then we look for the strongest stocks. We haven't gotten the full confirmation that China will be the new hot market, but the signals are increasing.
With that being said, let's take a look at the Chinese internet sector specifically. We're looking at the ratio between Chinese internet stocks (KWEB) and large cap Chinese stocks (FXI). History shows that when this market runs, it really runs, so we'll want to watch for the leader emerging from the country.
If China starts to turn up, I would expect KWEB to start outperforming FXI. In other words, look for this ratio to turn higher. Right now, it's threatening a breakdown from an inverted saucer formation, and it's hanging onto support. Let's see if it can make a higher-low with respect to the longer-term trend instead. That's what bulls will want to see.
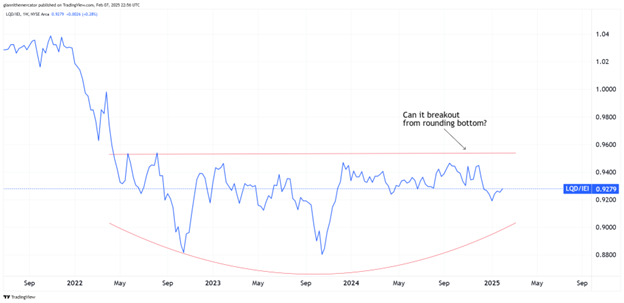
Is Liquidity About to Get Lit? Sector ETF: LQD IEI
This may be one of the most important charts in the entire market right now. With all of the intraday volatility we've seen, along with the "tariff tantrums," we've yet to see any meaningful deterioration when it comes to liquidity.
One of my favorite ways to measure market liquidity is to look at the performance differential between investment-grade corporate debt (LQD) and 3-7 Year Treasuries (IEI). When LQD outperforms IEI, it signals liquidity is improving, but when IEI outperforms LQD, it signals liquidity is drying up.
This is key to watch because the odds of a sharp market downturn are highly unlikely when liquidity is strong. I've been watching this rounding bottom pattern for a while now, and I'm still keen on the ratio breaking it to the upside.
Editor's Take:
What we've seen go down over the past few months in bonds is highly unusual. That is, the Fed started cutting rates back in September, but it set off a tremendous selloff in bonds on the longer-end of the yield curve.
I think we're in the early stages of a recovery in bonds, and that they will continue to rally for most of this year. If Treasuries rally, then I would look for corporate debt to rally even more. This means liquidity conditions will improve.
The ramifications for this when it comes to stocks is that overall volatility will probably be contained. There may be wide swings on a daily basis, but dips are likely to be bought. It's probably a year to have a longer-time horizon on trades.
Cryptocurrency
Bitcoin’s price action has entered an intriguing phase as it forms a clear rectangular consolidation pattern between $92,000 and $108,000. The well-defined trading range has created multiple opportunities for both buyers and sellers, but the overall structure remains bullish given the context of the preceding rally.
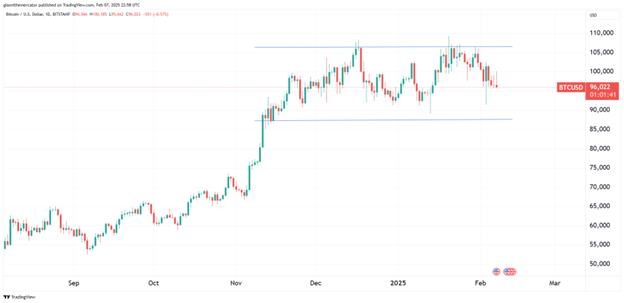
The fact that Bitcoin has maintained its position mostly above $90,000 during this consolidation phase, even amidst recent selling pressure, suggests underlying strength in the market. The decreasing volatility within this range often precedes a significant directional move, and the context favors an upward resolution.
Looking ahead, a decisive break above the $108,000 resistance level could trigger a substantial move higher, with the measured move from this rectangle pattern suggesting potential targets around $124,000. However, traders should remain vigilant – a sustained break below $92,000 would warrant a reassessment of the bullish thesis. For now, the technical structure suggests this compression is likely building energy for the next leg higher.
Legal Disclosures:
This communication is provided for information purposes only.
This communication has been prepared based upon information, including market prices, data and other information, from sources believed to be reliable, but Benzinga does not warrant its completeness or accuracy except with respect to any disclosures relative to Benzinga and/or its affiliates and an analyst’s involvement with any company (or security, other financial product or other asset class) that may be the subject of this communication. Any opinions and estimates constitute our judgment as of the date of this material and are subject to change without notice. Past performance is not indicative of future results. This communication is not intended as an offer or solicitation for the purchase or sale of any financial instrument. Benzinga does not provide individually tailored investment advice. Any opinions and recommendations herein do not take into account individual client circumstances, objectives, or needs and are not intended as recommendations of particular securities, financial instruments or strategies to particular clients. You must make your own independent decisions regarding any securities, financial instruments or strategies mentioned or related to the information herein. Periodic updates may be provided on companies, issuers or industries based on specific developments or announcements, market conditions or any other publicly available information. However, Benzinga may be restricted from updating information contained in this communication for regulatory or other reasons. Clients should contact analysts and execute transactions through a Benzinga subsidiary or affiliate in their home jurisdiction unless governing law permits otherwise.
This communication may not be redistributed or retransmitted, in whole or in part, or in any form or manner, without the express written consent of Benzinga. Any unauthorized use or disclosure is prohibited. Receipt and review of this information constitutes your agreement not to redistribute or retransmit the contents and information contained in this communication without first obtaining express permission from an authorized officer of Benzinga. Copyright 2022 Benzinga. All rights reserved.
© 2025 Benzinga.com. Benzinga does not provide investment advice. All rights reserved.
Trade confidently with insights and alerts from analyst ratings, free reports and breaking news that affects the stocks you care about.

