Your Exclusive Benzinga Insider Report
(DO NOT FORWARD)
By analyst Gianni Di Poce
Volume 4.07
Market Overview (Member Only)
- It was new all-time weekly closing highs for the Nasdaq and S&P 500, which finished up 2.58% and 1.47%, respectively. The Dow Jones Industrial Average fell short but still closed up a cool 0.55% on the week.
- Chinese equities are ripping to the upside as we expected. Look for this trend to continue.
- Tech emerged as the leader domestically, which is a bullish sign as well.
- Look for both tech and China to benefit from lower interest rates in the United States.
Stocks I Like
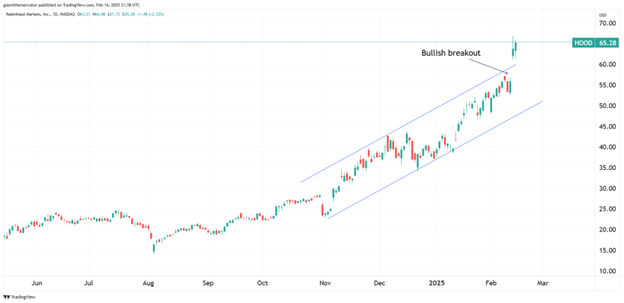
Robinhood HOOD – 23% Return Potential
What's Happening
- Robinhood (HOOD) is a financial services company that offers commission-free trading for stocks, options, and cryptocurrencies through its easy-to-use platform. The company aims to democratize finance by making investing more accessible to everyone, particularly younger, tech-savvy individuals.
- The revenue and earnings trend in HOOD has generally been positive. Last quarter, the company brought in $637 million in revenue and $150 million in earnings.
- This valuation on HOOD is very high, with the P/E at 97.01, the Price-to-Sales at 20.48, and its EV to EBITDA at 76.55.
- At a technical level, HOOD is bullish as it exploded from the ascending price channel, which implies a continuation of trend.
Why It's Happening
- With 25.1M investment accounts and $152B in assets under custody, HOOD's growing ecosystem locks in recurring revenue streams. Monthly active users hit 11M – critical for cross-selling new products.
- The recent integration of CME Group futures trading brings commodities, indices, and interest rate markets to Robinhood's 25M users. This premium product could generate $200M+ annual revenue from sophisticated traders.
- With the new administration's pro-crypto stance, HOOD's bitcoin/ether trading dominance positions it to capture institutional flows. Crypto volumes already doubled in Q3 – expect regulatory clarity to supercharge this vertical.
- Analyst Ratings:
- Mizuho: Outperform
- Raymond James: Market Perform
- Keybanc: Overweight
My Action Plan (23% Return Potential)
- I am bullish on HOODabove $46.00-$47.00. My upside target is $80.00-$82.00.
Applovin APP – 27% Return Potential
What's Happening
- AppLovin (APP) is a mobile marketing platform that specializes in helping developers grow and monetize their apps. The company provides a range of services, including user acquisition, ad revenue optimization, and analytics.
- We see steady revenue and earnings growth over the past four quarters here in APP. Most recently, they reported $1.2 billion in revenue and $434.31 million in earnings.
- Market has high hopes for APP with its high valuation. P/E is at 116.83, Price-to-Sales is at 31.15, and EV to EBITDA is at 66.79.
- From a charting perspective, APP just broke out from an ascending triangle, which is a continuation pattern. Look for the trend to continue here.
Why It's Happening
- With AI driving 80% of recent revenue growth, AppLovin is being positioned as the "picks and shovels" play for the AI gold rush. Retail trading volume surged 40% YTD, suggesting growing mainstream recognition.
- Though ad-tech leads, AppLovin's owned apps like "Monopoly GO!" still drive 30% of revenue. The mobile gaming market is rebounding, projected to grow 8% annually through 2027. This dual revenue stream hedges against ad market cyclicality.
- Oppenheimer reiterated its Outperform rating ahead of earnings, citing AppLovin's ability to beat Q4 consensus estimates. With shares at $384 and a $480 target, this implies a 25% return potential in 2025 – especially compelling given the stock's 729% 12-month rally. The firm calls AppLovin its "top pick" across all coverage areas
- Early results from the e-commerce advertising pilot show 100% incremental traffic for brands, with ROAS outperforming Meta and Google channels. Management confirmed a $30M-$50M revenue contribution in Q4 2024, and the mid-2025 launch of a self-service platform could unlock a $200B+ global e-commerce ad market. This vertical-agnostic approach positions AppLovin to disrupt Meta's dominance in retail media.
- AppLovin's board authorized a buyback representing 9% of market cap. Aggressive repurchases at current valuations would be immediately accretive, potentially boosting EPS by 15% in 2025.
- AppLovin's proprietary AXON AI algorithm is revolutionizing mobile advertising, delivering 66% YoY revenue growth in its software platform segment. By optimizing ad targeting and bidding in real-time, AXON enables advertisers to achieve superior ROAS compared to legacy platforms like Google Ads.
- Analyst Ratings:
- Goldman Sachs: Neutral
- UBS: Buy
- Wells Fargo: Overweight
My Action Plan (27% Return Potential)
- I am bullish on APPabove $380.00-$400.00. My upside target is $650.00-$670.00.
Market-Moving Catalysts for the Week Ahead
Data Tells the Story, But Not What to Do
Last week, we had a couple hot inflation readings on both the CPI and PPI level. There were also some upward revisions from previous reports that implied that previous reports understated the level of inflation in the economy. It rattled markets at first, but we saw a swift recovery afterwards.
The price action in bonds was particularly interesting. I still think this is where most of the action is taking place right now, and it's interesting to note how the Dollar seems to drop every time that bonds rally.
I'm not too worried about inflation at the moment because energy prices are still very much contained. To reiterate, the government has a goldilocks scenario right now here inflation is relatively contained to make the meaningful fiscal reforms necessary for the long-term financial health of the country. They're up against the clock.
Don't Get Caught Up in the Recent Past
Stocks are within a spitting distance of new all-time highs, and for years, we were spoiled by U.S. markets outperforming the rest of the world by a wide margin. But in recent weeks, I shared some important data points on how we could see a pause in that trend, and how China especially could benefit in the near-term.
We must always consider what's called recency bias when it comes to trading. There is such a thing as trading with the trend, which will improve the odds of your success as a trader, but it's important to remember that nothing last forever.
That said, markets have a tendency to exhibit trends that last longer than most expect. These tend to last at an asset level, but themes within those asset classes often change on a more frequent basis. It's important to stay nimble, and if you catch yourself feeling too smart in this time, be ready to play some defense.
Sector & Industry Strength (Member Only)
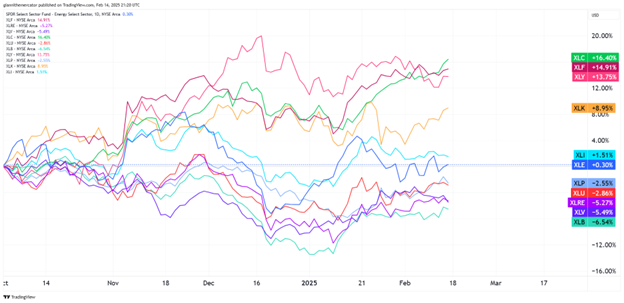
We're only one full trading week away from the final 1/3 of the first quarter if you can believe it already. As a result, I wanted to zoom in a bit more on the sector performance rankings, and tighten up the timeframe to the start of Q4 2024.
If anything, it reveals an even stronger tape internally. The top-three performing sectors are all risk-on. We have communications (XLC), financials (XLF), and consumer discretionary (XLY) leading the pack, which is a very good sign.
I'm also pleased with tech's (XLK) emerging recovery. I'd look for this to continue in the coming weeks as well. As long as we continue to see sectors like utilities (XLU), consumer staples (XLP), and healthcare (XLV) near the bottom of the pack, I like what's happening in this market.
| 1 week | 3 Weeks | 13 Weeks | 26 Weeks |
| Technology | Consumer Staples | Communications | Consumer Discretionary |
Editor's Note: With tech back on the scoreboard, it's hard to be bearish.
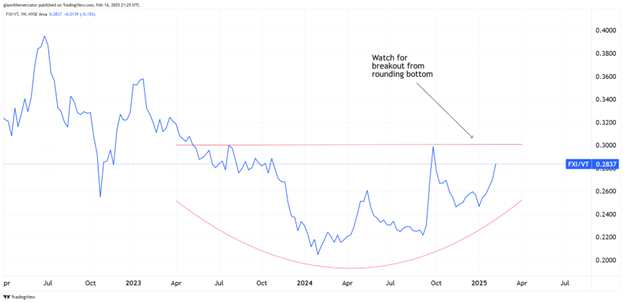
China Emerging as New Leader (Sector ETF: FXI/VT)
Several weeks ago, we started pointing out the emerging strength on a relative basis coming from China. We compared it against U.S. markets, and last week, even dove deeper and looked at how Chinese internet stocks could be a major beneficiary.
But this week, I want to compare the Chinese market (FXI) to global stocks (VT). After all, we can't just compare China just to the U.S. and be satisfied. It's a global market out there, and money is always looking for the best opportunities.
This ratio chart shows how China (FXI) underperformed global stocks (VT) for years. But we're on the precipice of breaking out from a rounding bottom formation. If successful, we'll probably start seeing Chinese markets dominate the headlines – tariffs or not.
Taking Stock of Inflation (Sector ETF: SPY/DBC)
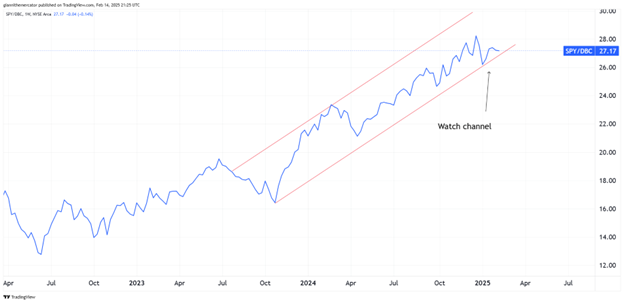
Normally, we look at the bond market when it comes to inflation. But it's been a while since I shared the ratio between stocks (SPY) and commodities (DBC). Plus, it's important to remember that measuring inflation from the market itself isn't just a one-trick pony.
The key to understanding the role of commodities in one's portfolio is this: When inflationary pressures are accelerating, commodities (DBC) will outperform stocks (SPY). But if inflation is absent or slowing down, then stocks will generally outperform.
We see how SPY has outperformed DBC by a wide margin since June 2022. Coincidently, that's when inflation data peaked. But with last week's hotter-than-expected reading, keep an eye on this ratio to see if it starts breaking the lower trendline of the channel. It would make things much more interesting on the inflation front.
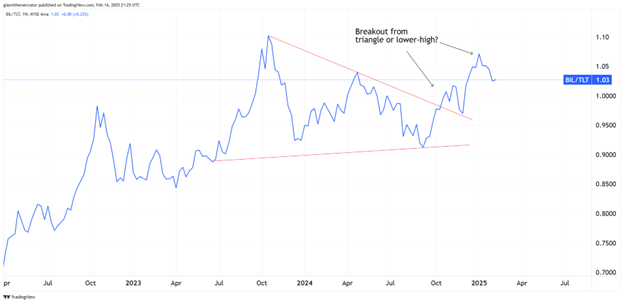
Bonds Still Asking the Trillion Dollar Question (Sector ETF: BIL/TLT)
Bonds got hammered last week after the inflation report, so it's high-time to bring back this ratio between the shortest-end of the curve and the longest-end of the curve. I'm talking about short-term Treasury Bills (BIL) compared to long-term Treasury Bonds (TLT).
Knowing how these two bonds are performing against one another is critical to navigating markets, inflation, and more. When BIL outperforms, it signals that inflation expectations are ticking higher, which hurts TLT more. When TLT outperforms, it means that inflationary pressures are contained or slowing down.
The big question on this ratio is whether we're seeing a continuation of the trend following the breakout from the triangle pattern late last year. If not, we could be forming a lower-high here in the ratio, which is the first step for a meaningful reversal lower.
Editor's Take:
It's interesting to watch the macroeconomic puzzle evolve with the prospect for tariffs, tax cuts, lower interest rates, and a strong Dollar. They're all connected and playing out in the bond markets very aggressively.
President Trump wants interest rates to come down, but it would probably be more beneficial for them to come down on the longer-end of the curve specifically. It seems that Treasury Secretary Scott Bessent has similar ideas.
We've discussed before how inflation is likely to make a comeback at some point. There isn't much time to make the reforms needed to the federal budget, so they're really up against the clock. If long-term bonds continue to implode, inflation is going to become a real problem again.
Bitcoin’s price continues to trade within distinct rectangular consolidation pattern ranging from $92,000 to $108,000. This clear trading range has provided numerous entry points for both buyers and sellers, yet the broader market sentiment remains bullish, considering the strong upward trend that preceded this consolidation.
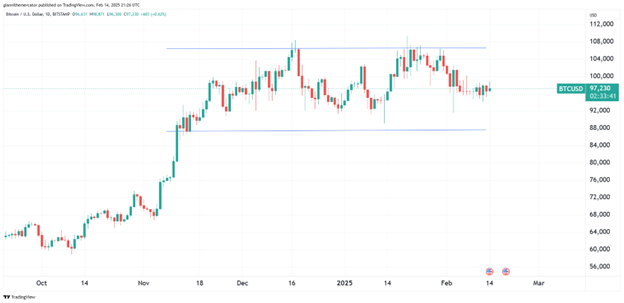
Bitcoin’s ability to stay predominantly above $90,000 throughout this consolidation, despite recent sell-offs, indicates a robust market foundation. The reduced volatility seen in this period typically signals an impending major move, with the current scenario leaning towards an upward breakout.
In the near future, breaking convincingly above the $108,000 resistance could set off a significant upward trend, with the rectangle pattern indicating possible price targets near $124,000. However, caution is advised; if Bitcoin falls decisively below $92,000, it would be time to reconsider the bullish outlook. Currently, the technical setup hints that this period of consolidation is accumulating momentum for an upward continuation.
Legal Disclosures:
This communication is provided for information purposes only.
This communication has been prepared based upon information, including market prices, data and other information, from sources believed to be reliable, but Benzinga does not warrant its completeness or accuracy except with respect to any disclosures relative to Benzinga and/or its affiliates and an analyst’s involvement with any company (or security, other financial product or other asset class) that may be the subject of this communication. Any opinions and estimates constitute our judgment as of the date of this material and are subject to change without notice. Past performance is not indicative of future results. This communication is not intended as an offer or solicitation for the purchase or sale of any financial instrument. Benzinga does not provide individually tailored investment advice. Any opinions and recommendations herein do not take into account individual client circumstances, objectives, or needs and are not intended as recommendations of particular securities, financial instruments or strategies to particular clients. You must make your own independent decisions regarding any securities, financial instruments or strategies mentioned or related to the information herein. Periodic updates may be provided on companies, issuers or industries based on specific developments or announcements, market conditions or any other publicly available information. However, Benzinga may be restricted from updating information contained in this communication for regulatory or other reasons. Clients should contact analysts and execute transactions through a Benzinga subsidiary or affiliate in their home jurisdiction unless governing law permits otherwise.
This communication may not be redistributed or retransmitted, in whole or in part, or in any form or manner, without the express written consent of Benzinga. Any unauthorized use or disclosure is prohibited. Receipt and review of this information constitutes your agreement not to redistribute or retransmit the contents and information contained in this communication without first obtaining express permission from an authorized officer of Benzinga. Copyright 2022 Benzinga. All rights reserved.
© 2025 Benzinga.com. Benzinga does not provide investment advice. All rights reserved.
Trade confidently with insights and alerts from analyst ratings, free reports and breaking news that affects the stocks you care about.

