Market Overview (Member Only)
- Stocks sold off hard across the board last week. The Nasdaq and Dow Jones Industrial Average were both down 2.51%, while the S&P 500 was down 1.66%.
- Amidst the carnage in the U.S., Chinese stocks continued their rip higher, finishing up over 3% on the week.
- Consumer staples ran the table in the U.S. last week, which is a short-term risk off signal.
- Key inflation data this week but it seems that geopolitical concerns are rising in the coming days.
Stocks I Like
Alibaba BABA 29% Return Potential
What's Happening
- Alibaba (BABA) is a leading global e-commerce and technology company that provides a wide range of services, including online retail, cloud computing, digital entertainment, and more.
- In the past year, BABA's revenue has fluctuated, but they managed to consistently grow earnings. Their Q3 2024 results showed $236.5 billion in revenue and $43.87 billion in earnings.
- This valuation on BABA is slightly elevated, with the P/E at 25.90, the Price-to-Sales at 2.34, and its EV to EBITDA at 13.67.
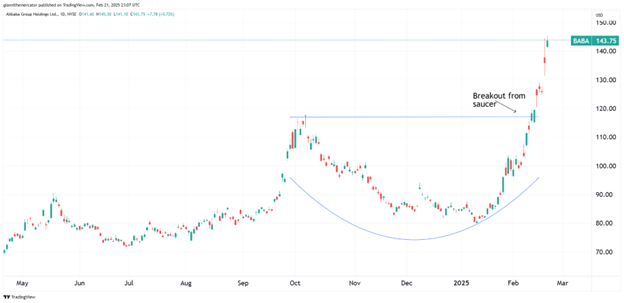
- From a technical standpoint, BABA just broke out from a sauce formation, which signals a new bull market is underway.
Why It's Happening
- Alibaba's Qwen2.5 Max AI model has surpassed OpenAI's GPT-4 and Meta's LLaMA-3.1-405B in benchmark tests, positioning the company as a leader in generative AI. This technological edge could drive adoption across industries, from enterprise cloud solutions to consumer applications.
- Apple's decision to use Alibaba's AI models for iPhones in China is a game-changer. This partnership validates Alibaba's technical prowess and directly links its cloud infrastructure to Apple's massive user base. Analysts project increased utilization of Alibaba Cloud as iPhone users access AI-driven features like real-time translation and smart assistants, creating a recurring revenue stream.
- Alibaba Cloud's partnership with Apple and AI-driven enterprise demand could boost operating margins from 3% to 10% by 2026. With cloud revenue projected to grow 18% annually, this $14B division alone could justify a $100B valuation (7x sales) within two years.
- Alibaba's $25B buyback program and growing dividend yield of 1.2% signal confidence in cash flow sustainability.
- Analysts forecast 24% EPS growth in 2025, with Q3 FY25 earnings expected to rise 2.7% YoY to $2.67 per share.
- BABA's 46% YTD surge has forced some short covering, but 20% of float remains shorted. A strong Q3 earnings beat on February 20 could trigger a violent squeeze, mirroring the 2023 rally when shorts retreated.
- Analyst Ratings:
- Citigroup: Buy
- Barclays: Overweight
- Benchmark: Buy
My Action Plan (29% Return Potential)
- I am bullish on BABA above $108.00-$110.00. My upside target is $185.00-$190.00.
Frontdoor FTDR 57% Return Potential
What's Happening
- Frontdoor (FTDR) is a home service company that connects homeowners with professional contractors for maintenance and repair services.
- FTDR capped off a strong quarter recently, as they reported $540 million in revenue and $100 million in earnings.
- Valuations are pretty fair on this stock, with P/E at 19.68, Price-to-Sales at 2.55, and EV to EBITDA at 12.11.
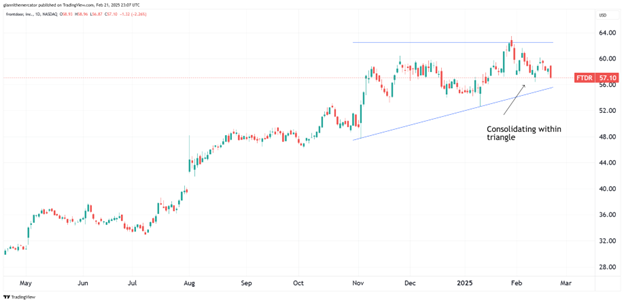
- At a technical level, FTDR is coiling tightly within an ascending triangle pattern. We're looking for a continuation of the underlying bull trend here.
Why It's Happening
- The new on-demand HVAC service is the first step in creating a home services super app. By bundling warranties with à la carte repairs, FTDR can 3x customer LTV while collecting invaluable IoT data on home systems—a hidden asset not reflected in GAAP metrics.
- Record retention rate from Frontdoor of 77.7% drives a virtuous cycle: Every 1% retention improvement adds ~$18M annualized revenue at 90%+ incremental margins. The new AHS app—boosting engagement—could push retention to 80%+ by 2025E, unlocking $50M+ high-margin cash flow.
- Management deployed $119M YTD to repurchase 3.2M shares. With authorization remaining and $375M cash reserves, FTDR could reduce shares outstanding by 5-7% annually—a tangible EPS booster equivalent to 15% organic growth.
- The pending 2-10 acquisition which is not yet priced into shares gives FTDR dominance in new construction structural warranties. This $2B+ market grows at 6% CAGR alongside housing starts.
- Frontdoor's Q3 gross margin surged 550 bps to 57%, driven by pricing power and process efficiencies. This structural improvement—far exceeding the sector average—positions FTDR to amplify EPS growth even in a flat revenue environment.
- Despite a cooling housing market, net income jumped 40% YoY to $100M in Q3. This demonstrates the resilience of Frontdoor's subscription-like home warranty model.
- Analyst Ratings:
- Truist Securities: Buy
- Goldman Sachs: Sell
- JP Morgan: Overweight
My Action Plan (57% Return Potential)
I am bullish on FTDR above $51.00-$52.00. My upside target is $90.00-$100.00.
Starbucks SBUX 43% Return Potential
What's Happening
- Starbucks (SBUX) is a global coffeehouse chain known for its premium coffee, handcrafted beverages, and a variety of food offerings.
- In the most recent quarter, Starbucks reported $9.4 billion in revenue and $780.8 million in earnings.
- Its valuation is rather elevated, however. Its P/E is at 36.31, its Price-to-Sales is at 3.54, and its EV to EBITDA is at 22.02.
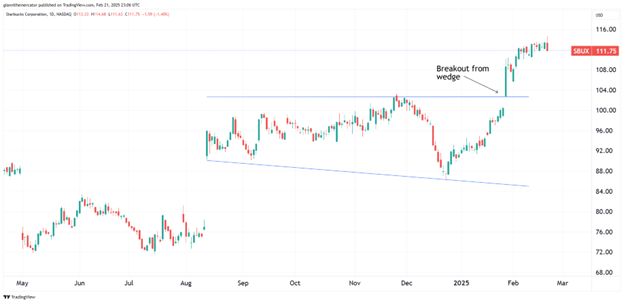
- From a charting standpoint, SBUX just broke out from a broadening wedge pattern. Look for upside momentum to continue accelerating.
Why It's Happening
- CEO Brian Niccol's turnaround plan includes doubling U.S. barista wages, streamlining menus, and renovating stores. These efforts aim to reduce wait times, improve employee retention, and reignite the in-store experience.
- With 34.6M U.S. Rewards members, Starbucks leverages data-driven personalization to drive repeat visits. Members account for ~57% of sales, creating a subscription-like revenue stream. Recent app upgrades and tailored offers position SBUX to monetize this base further as consumer spending rebounds
- Though China comps fell 4% in Q1, Starbucks opened 169 net new stores there (10% YoY growth). With just 0.15 stores per 10K people vs. 1.3 in the U.S., the 6,000-store footprint lays groundwork for dominance as middle-class coffee demand surges post-pandemic.
- Starbucks' pledge to become resource-positive by 2030 (e.g., 50% water savings, 50% waste reduction) aligns with $30T+ global ESG mandates. Its recent $1B sustainability bond issuance was 3x oversubscribed, lowering borrowing costs and cementing its appeal to green investors.
- Starbucks repurchased $2.5B in shares over the past year, reducing shares outstanding by 1.3%. With $5B remaining in its buyback authorization, continued buybacks could boost EPS by 3-4% annually even if net income stagnates.
- Starbucks raised its dividend at a 20% CAGR over the last 14 years, declaring a $0.61/share quarterly payout in Q1 2025. This track record signals robust cash flow discipline and appeals to income-focused investors.
- Analyst Ratings:
- RBC Capital: Outperform
- UBS: Neutral
- BMO Capital: Outperform
My Action Plan (43% Return Potential)
- I am bullish on SBUX above $97.00-$98.00. My upside target is $160.00-$165.00.
Market-Moving Catalysts for the Week Ahead
Earnings Wind Down, Big Data Ahead
The general results from earnings has been positive in the U.S. over the past few weeks, however, we've seen numerous instances where a company reports positive results, only for the stock to gap down double digits.
Even though stocks are at or around new all-time highs, there is no shortage of jitters, as one misstep on behalf of management during a conference call risks their stock getting pummeled in the pre-market or post-market.
I don't expect these jitters to go away anytime soon, especially as we head into another key week of economic data that has a GDP revision and more inflation information. For now, I expect the latter to be contained, but when it comes to the former, don't be surprised if we see some weakness later this year with all the government job cuts.
A Golden Opportunity Amidst the Chaos
It's hard to know whether the Trump administration is serious about curbing inflation, as a little bit of it would certainly help DOGE's goal of cleaning up the government's finances. The latest rumor is that a $5,000 stimulus check could be sent out in the form of a "refund" after all the spending cuts.
Will this be inflationary, or is it zeroed out due to the drop in spending overall? All I know is that precious metals seem to be thriving in this environment, as there are also rumors of a gold run taking place over in London.
Gold is pretty extended here in the short-term, but silver looks like a tremendous bargain. Would not be surprised to see this metal trading back above $40.00 per ounce this year, which would be a massive tailwind for metal mining stocks.
Sector & Industry Strength (Member Only)
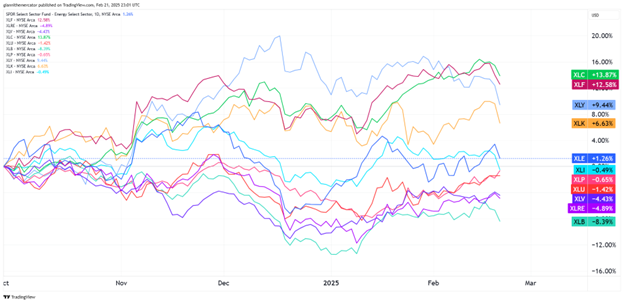
Stocks are still spinning their wheels near all-time highs, but the sector performance rankings going back to the start of Q4 2024 continue to tell the biggest story. Another week has passed and the right sectors continue to lead.
Any market that has sectors like communications (XLC), financials (XLF), consumer discretionary (XLY), and tech (XLK) as the top-performers is not one that's exhibiting bearish price action.
On the other side, a market with sectors like utilities (XLU), consumer staples (XLP), and healthcare (XLV) near the bottom of the pack only reinforces the idea that we're in a "risk-on" market environment.
| 1 week | 3 Weeks | 13 Weeks | 26 Weeks |
| Consumer Staples | Consumer Staples | Communications | Communications |
Editor's Note: Consumer staples gaining ground suggests caution near-term.
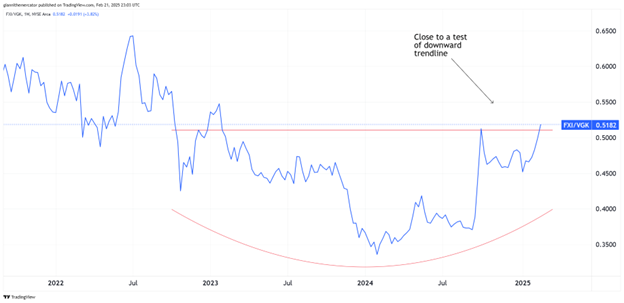
China Gathering Momentum – Sector ETF FXI VGK
I've been hammering home the China theme over the past few weeks, and I'm not going to stop until the magnitude of the situation is fully grasped. Historically, the Chinese market tends to exhibit tremendous rallies once it gets going, so it's key to pay attention at the right moments.
This week, we're comparing the performance of large-cap Chinese stocks (FXI) against a basket of European equities (VGK). We already established how Chinese stocks were outperforming U.S. stocks, but it's worth noting that European stocks have outperformed U.S. stocks year-to-date too.
The ratio here displays a rounding bottom formation, and if it clears the upper horizontal trendline acting as resistance, expect the headlines coming from China to reach a level of bullishness we've not seen in many years.
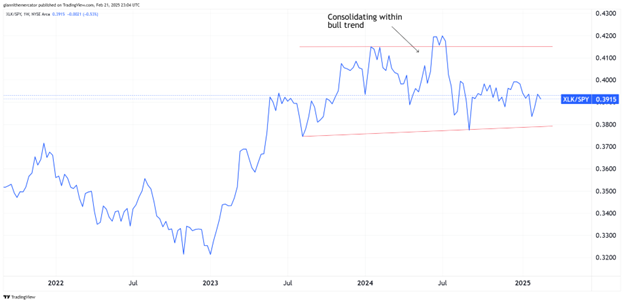
Don't Forget Domestic Developments – Sector ETF XLK SPY
Even though the most exciting market action appears to be taking place overseas, don't let it make you forget about important domestic developments. I want to revisit the tech sector (XLK) this week, since it recently showed some signs of life.
Technology is the largest, and consequently, most important sector in the U.S. market (SPY). As a result, its moves are going to have a great impact on the direction of the indices compared to other sectors.
The ratio chart here shows a long-term uptrend in this ratio, highlighting how tech has been an outperformer for years. But really, since mid-2024, it hasn't been the most exciting. It's trying to consolidate within the ascending triangle pattern. If it clears the upper horizontal trendline of the formation, look out for tech to come back into the headlines.
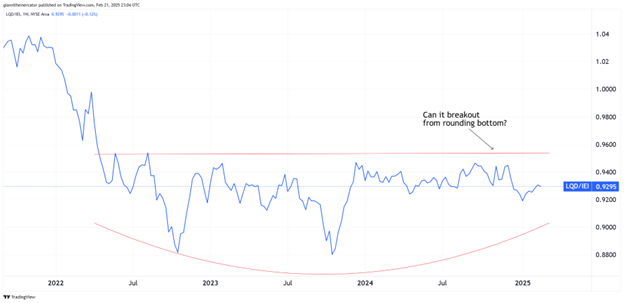
Liquidity Staying Put – Sector ETF LQD IEI
With stocks spinning their wheels near all-time highs amid calls for another market downturn to begin at any time, it's a good time to check in on the market's liquidity conditions. The signal comes from bond markets, and credit spread specifically. If liquidity conditions are stable, then you won't get a market crash, to be clear.
I like to use the performance differential between investment-grade corporate debt (LQD) and 3-7 Year Treasuries (IEI). Simply put, when LQD outperforms IEI, and the ratio rises, it signals strong liquidity conditions. When IEI outperforms LQD and the ratio drops, it signals weakening liquidity conditions.
We've been talking about the rounding bottom pattern in this ratio for a long time. We still haven't broken out, but the most important thing here in the near-term is that we're not seeing a sharp drop in this ratio.
Editor's Take:
There's a lot happening at a macroeconomic level at the moment. DOGE is a wild card and in theory, is resulting in contractionary policy as all those government dollars are sucked out of the economy.
In theory, this could weaken liquidity conditions. But at the same time, they could be offset by tax cuts and eventually, more Fed rate cuts. I think right now the Fed is just buying time until they resume the rate cuts.
Rate cuts, by definition, add liquidity into the system. The big thing is that we see the January low hold in this ratio between LQD/IEI. If it does, then I can't rule out an eventual breakout from this rounding bottom. This could send stocks soaring into the coming months.
Bitcoin continues to exhibit a compelling technical structure as it trades within a well-defined range between $90,000 and $108,000. This clean rectangular consolidation pattern, which has contained price action since December, represents a healthy period of accumulation following the explosive November rally.
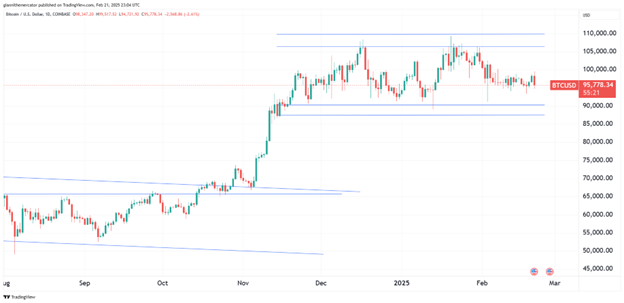
This type of price behavior, where dips are consistently bought, suggests underlying strength despite the ranging environment. Additionally, Bitcoin has maintained its position above the psychologically important $90,000 level throughout this consolidation phase.
Looking ahead, this rangebound price action appears to be creating the foundation for the next leg higher. Traders should watch for increasing volume on any move above $108,000 as confirmation of the breakout. However, risk management remains crucial – a sustained break below $90,000 would invalidate this bullish thesis and potentially signal a deeper correction.
© 2025 Benzinga.com. Benzinga does not provide investment advice. All rights reserved.
Trade confidently with insights and alerts from analyst ratings, free reports and breaking news that affects the stocks you care about.

