

Market Overview
Stocks finished mixed last week, as we saw the risk-off tape continue. The Nasdaq sold off the most, and finished 3.47% lower. The S&P 500 was only off 0.98%, while the Dow Jones Industrial Average actually rallied 0.95%. There were some modest improvements in the stock market's internals last week, with financials making a notable comeback. Cryptocurrencies got hammered but look to be carving out an important bottom. Interest rates continued their decline as more economic data points to inflation being under control. Earth to the Eccles Building: You can cut rates again.
Stocks I Like
Solventum SOLV – 23% Return Potential
What's Happening
- Solventum (SOLV) is a prominent company focused on delivering innovative healthcare solutions, offering a diverse portfolio of products and services designed to improve patient outcomes and advance medical care.
- Over the past year, SOLV has been growing its earnings nicely. In its most recent quarter, the company reported revenue of $2.08 billion and earnings of $122 million.
- This valuation on SOLV is sky-high. The P/E is at 199.66, the Price-to-Sales is at 1.59, and the EV to EBITDA is at 12.82.
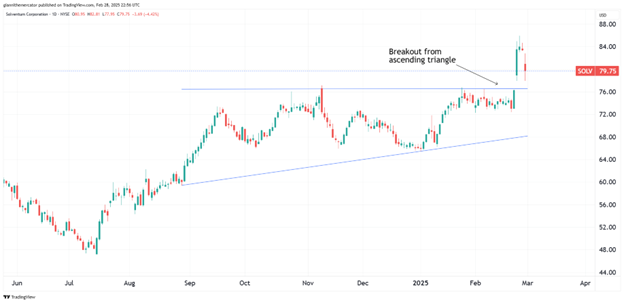
- From a technical standpoint, SOLV just broke out from an ascending triangle formation. This signals a continuation of the trend is underway.
Why It's Happening
- Solventum's $4.1 billion sale of its Purification & Filtration business to Thermo Fisher Scientific unlocks capital to prioritize core areas like medical/surgical solutions, oral care, and health IT. By shedding a non-core division, management can redirect resources toward higher-margin innovations in healthcare technology, where aging populations and chronic disease trends offer long-term tailwinds.
- The $3.4 billion in net proceeds from the Thermo Fisher deal will primarily repay debt, slashing Solventum's leverage ratio from ~4x EBITDA to a more sustainable ~2.5x.
- Despite divesting a $1B-revenue business, the deal is expected to be neutral to 2025 EPS, showcasing Solventum's ability to monetize non-core assets without diluting earnings.
- Solventum's planned Investor Day in March offers a platform to detail its “Phase 3” transformation strategy, including long-range financial targets and pipeline updates. Clear messaging on accelerating organic growth to 3-5% and expanding EBITDA margins beyond 25% could reset valuation multiples closer to peers like Zimmer Biomet.
- Post-spinoff cost synergies are still accruing—analysts estimate $150M+ in annual savings by 2026. Coupled with mix shifts toward higher-margin software/SaaS offerings in health IT, Solventum could achieve 300+ bps of EBITDA margin expansion in three years, driving EPS above $6.00 vs. $5.20 consensus.
- At $74/share, SOLV trades at a 30% discount to peers on EV/EBITDA (8.5x vs. 12x sector average).
- Analyst Ratings:
- Mizuho: Neutral
- Morgan Stanley: Equal-Weight
- Piper Sandler: Neutral
My Action Plan (23% Return Potential)
- I am bullish on SOLVabove $73.00-$74.00. My upside target is $98.00-$100.00.
Futu Holdings FUTU – 37% Return Potential
What's Happening
- Futu Holdings Limited (FUTU) is a leading digital brokerage and wealth management platform that provides online trading, investment services, and financial technology solutions to empower individual investors globally.
- FUTU has seen both its revenue and earnings rise over the past few quarters. The most recent one showed revenue of $3.44 billion and earnings of $1.32 billion.
- Valuations are slightly elevated in this name. P/E is at 26.97, Price-to-Sales is high at 10.38, and EV to EBITDA is at 20.36.
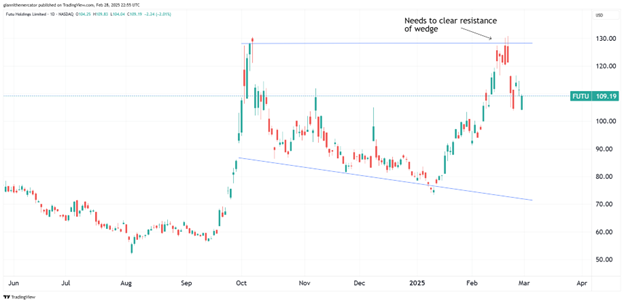
- From a technical standpoint, FUTU is consolidating within a wedge pattern. Look out above if it clears the upper horizontal trendline of the pattern.
Why It's Happening
- Futu added 1.2 million new users in Q4 2024, driven by its moomoo platform's viral social trading features. Southeast Asia—a $500B digital finance market—is its next frontier, with localized apps launching in Indonesia and Malaysia. This mirrors Tencent's WeChat Pay expansion, which unlocked decades of growth. Futu's addressable market could 5x by 2030.
- Futu will report Q4 and full-year 2024 results on March 13, 2025, with expectations of robust user growth and margin expansion. The stock surged 8.95% in February amid optimism around its Southeast Asian expansion, suggesting bullish momentum ahead of earnings. Analysts anticipate record revenue from its moomoo platform, which now serves over 20 million users.
- Futu's moomoo-Nasdaq options trading challenge (with $15K prizes) is a masterstroke to attract U.S. millennials. Over 500K participants joined in February, signaling a beachhead into Robinhood's core demographic. U.S. revenue could jump from 12% to 25% of total by 2025, adding $2B+ in upside.
- With $2.8B retained earnings, Futu is expected to announce its first-ever dividend post-Q4 earnings. A 1.5% yield would align with Tencent's payout, attracting income funds. Dividends often trigger re-rating—see Sea Limited's 15% pop after its 2024 dividend initiation.
- Beijing's new "Fintech Innovation Zone" policy exempts firms like Futu from tighter brokerage caps. Futu can now offer leverage up to 5x (vs. 3x previously), boosting interest income. Regulatory risks are priced out—Futu's Hong Kong license renewal in January confirms compliance.
- 14% of float is shorted—a 2-year high—as bears bet against Asia's retail slump. But with 8.95% short-term borrow fee costs and bullish earnings momentum, a squeeze could mirror January 2025's 25% rally.
- Analyst Ratings:
- Citigroup: Neutral
- B of A Securities: Buy
- JP Morgan: Overweight
My Action Plan (37% Return Potential)
I am bullish on FUTUabove $92.00-$94.00. My upside target is $150.00-$160.00.
Byrna Technologies BYRN – 86% Return Potential
What's Happening
- Byrna Technologies Inc. (BYRN) is a cutting-edge technology company specializing in the development, manufacture, and sale of innovative, less-lethal personal security solutions, providing effective self-defense options for consumers and professionals worldwide.
- Revenue and earnings have been growing nicely in this name as well. In the most recent quarter, BYRN reported revenue of $27.98 million while earnings were $9.67 million.
- Its valuation is rather elevated. P/E is at 48.63, Price-to-Sales is at 7.21, and its EV to EBITDA is at 71.39.
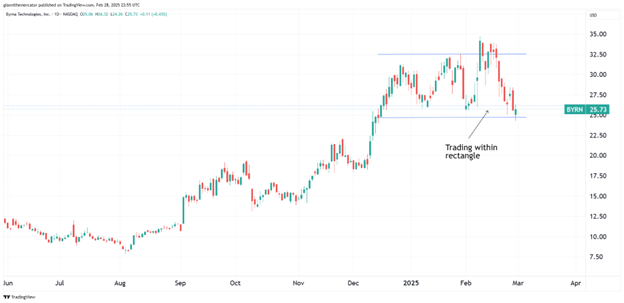
- From a charting standpoint, BYRN is churning within a rectangle pattern. It would need to clear the upper horizontal trendline of the pattern to breakout, however.
Why It's Happening
- The mid-2025 Compact Launcher launch addresses the $2B+ concealed carry market with a smaller form factor. Early prototypes suggest 25% cost savings vs current models, which – combined with 62%+ margins – could add $50M+ incremental revenue by 2026. This innovation cycle keeps BYRN ahead of TASER and PepperBall.
- The Nashville store opening taps into experiential retail's power. Compared to 1% online conversion, physical stores' 80% close rate suggests a massive upside as they expand to 100 Sportsman's Warehouse locations by 2026. This omnichannel approach could triple retail's revenue share to 30% by 2027.
- 2024 transformed BYRN from debt-dependent to $22M+ in net cash, powered by $12.8M net income vs 2023's $8.2M loss. This liquidity positions them to fund growth sans dilution – critical as competitors like Axon (TASER) spend heavily on R&D. Expect upgraded credit ratings to lower future capex costs.
- With 75% of revenue domestic, BYRN is barely scratching the $12B international less-lethal market. Recent EU protests and LATAM crime waves create urgency for their export-ready products. The “Made in America” branding plays perfectly into allied nations' preference for U.S. defense tech.
- Byrna's gross margin jumped to 62.8% in Q4 from 55.5% in 2023 through component cost reductions and manufacturing scale. For context, every 1% margin improvement adds $858k annually at current revenue – a lever most peers lack.
- Byrna smashed Q4 2024 EPS estimates by 320% ($0.21 vs. $0.05 expected), marking its third consecutive quarter of triple-digit earnings surprises.
- Analyst Ratings:
- Roth MKM: Buy
- Ladenburg Thalmann: Buy
- B. Riley Securities: Buy
My Action Plan (86% Return Potential)
- I am bullish on BYRNabove $22.00-$23.00. My upside target is $48.00-$50.00.
Market-Moving Catalysts for the Week Ahead
A Recession in the Shadows?
The degree of drastic changes taking place at a federal level right now cannot be ignored. For years, government spending helped keep the economy afloat, and to an extent, it maintained the illusion of strong economic growth.
But with all these spending cuts taking place, interest rates dropping, and the yield curve heading back towards inverted territory, could markets be starting to price in a recession? The crowd certainly seems to think so.
The logic behind such a conclusion isn't bad. The problem is that markets don't move based on facts, logic, or common sense. Instead, markets move based on perception and emotions like fear and greed. This is why studying price action proves to be a worthwhile use of one's time.
Avoid Getting Chopped Up in the Chop
Stocks have a lot to contend with at the moment, both domestically and abroad. We've been talking a lot about China in this report, and I continue to find the best trading setups that are working most-easily from that country.
So, where does this leave U.S. stocks? Remember that the market loves to trade in a way that frustrates the largest number of its participants. Right now, I don't see major downside on the immediate horizon. It would placate the large number of bears too much.
Instead, we'll probably see markets continue their sideways action, and form a solid technical base. As a rule, any market that goes sideways near the highs is displaying bullish price action, and always remember that markets can correct through time instead of price too. At some point, I expect a breakout to new all-time highs, but we may have to wait a bit longer for it to play out.
Sector & Industry Strength
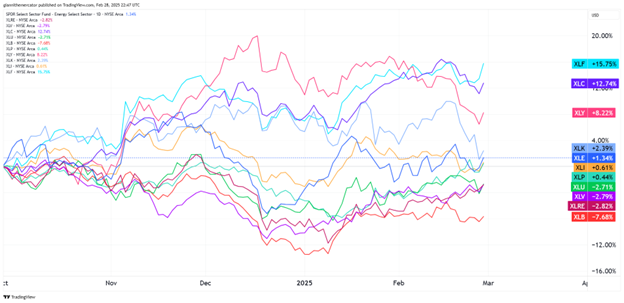
There's been some notable deterioration in the quality of the tape over the past couple of weeks, especially considering that over half of the sectors are now trading in negative territory since the start of Q4 2024.
The good news for the bulls is that growth oriented sectors like financials XLF, communications XLC, consumer discretionary XLY, and tech XLK are still in the top-half of the leadership.
The defensive sectors like healthcare XLV and consumer staples XLP are still near the bottom, despite their dominance in the near-term. Is this a buy the dip signal? We'll probably have our answer in the next week or two.
| 1 week | 3 Weeks | 13 Weeks | 26 Weeks |
| Financials | Consumer Staples | Communications | Financials |
Editor's Note: Financials coming back into the picture isn't bearish.
Concerns with Chips (Sector ETF: SMH/QQQ)
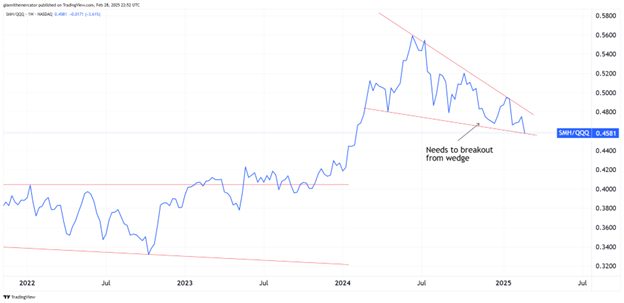
It's been a few weeks since we looked at one of the market's most important indicators within the tech sector specifically. Remember, technology is the largest and thus most important sector in the entire market. It's going to have a bigger impact on the direction of stock prices than any other sector.
To help gauge the health of technology, I like to look at the ratio between semiconductors (SMH) and the Nasdaq 100 (QQQ). Almost all of the major advancements coming from the tech sector need upgraded chips, so if we're seeing SMH lag QQQ, it signals that something is wrong in semiconductor land.
Since June, we've seen SMH lag against QQQ. But the ratio has coiled into a wedge formation, and if it can manage to break above the upper trendline of the channel, it could lead to a continuation of the longer-term trend that favors SMH over QQQ.
The Quantum Future (Sector ETF: QTUM/XLK)
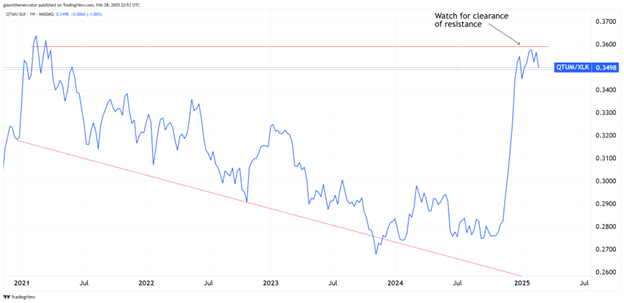
Perhaps one of the biggest developments in the tech space over the past year has been in the field of quantum computing. There is some controversy and disagreement amongst tech leaders in terms of how far we are from quantum computing becoming viable, but remember, in markets, perception matters more than reality.
We're looking at the ratio here between the quantum computing sector (QTUM) and technology (XLK). Ever since the summer of 2024, we've seen quantum emerge as a bit theme in the tech space. It really began to take at the end of last year.
A broadening wedge pattern is present on the ratio between QTUM and XLK. If it breaks above the upper horizontal trendline of the pattern, look for quantum to establish its dominance as the big tech theme of 2025. It's still very early.
It's Now or Never for Treasury Bonds (Sector ETF: BIL/TLT)
There's a complete revamping of the federal budget unfolding now with DOGE. And when it comes to understanding the impact this is having on markets, and specifically bonds, it's imperative that we cast aside our judgements of whether this is good or bad. It's what's happening, so we have to deal with it in the tape.
The federal government has been in big trouble financially for years. But as interest rates spiked over the past few years, it reached a point where interest expenditures became dangerously high within the budget.
The key now is to see whether these fiscal reforms will give the government's lenders some more confidence in what's going on in Washington, and in turn, offer them lower interest rates on the Treasuries. From an investment standpoint, we need to know where the best money can be made in bonds in the near-term.
My Take:
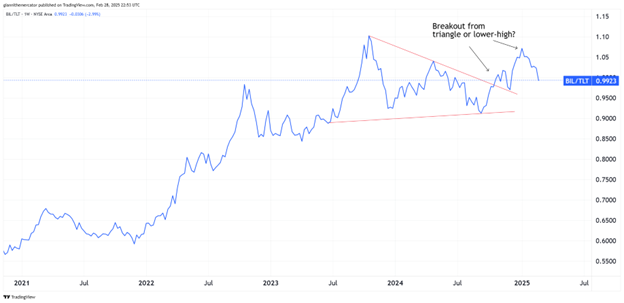
I like to look at the ratio between short-term Treasury Bills (TBIL) against long-term Treasury Bonds (TLT) to help measure this. When we're in a real bond bull market, we want to see this ratio fall, or TLT outperform BIL.
The reason behind this is that when bonds are selling off (rates are rising) investors flock to the short-end of the yield curve for protection. When they do this, they're more likely to have interest rates that match the prevailing rate of inflation.
But when rates top out, and bonds start rallying, those longer-term bonds that had higher rates look awfully appetizing to the market, and therefore, they start trading at a premium. If this ratio keeps falling, we'll have our signal that bonds are entering a new bull phase, and inflation isn't really a problem.
Cryptocurrency
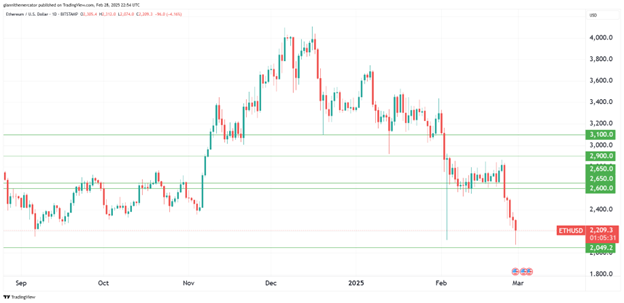
Ethereum has reached a critical technical juncture as it tests the significant support level around $2,250, which has served as a key price floor multiple times since early 2024. This well-defined trading range between $2,250 and $4,100 has contained ETH price action for over a year now, creating clear zones of support and resistance.
Historically, each time Ethereum has visited this $2,200-2,300 zone, it has staged impressive rallies of 70-80% toward the upper boundary of the range. The risk-reward ratio at current levels is exceptionally favorable, with clear invalidation points just below the support level.
As I’ve likened Ethereum to silver in previous analyses, it tends to behave like a leveraged position relative to Bitcoin, often displaying more dramatic percentage moves once trends establish. With Bitcoin showing signs of stabilization in its own consolidation pattern, Ethereum could be poised to outperform if the broader crypto market regains its footing. However, traders should remain vigilant – a decisive break below $2,000 would invalidate this bullish thesis and potentially signal a deeper correction.
Legal Disclosures:
This communication is provided for information purposes only.
This communication has been prepared based upon information, including market prices, data and other information, from sources believed to be reliable, but Benzinga does not warrant its completeness or accuracy except with respect to any disclosures relative to Benzinga and/or its affiliates and an analyst’s involvement with any company (or security, other financial product or other asset class) that may be the subject of this communication. Any opinions and estimates constitute our judgment as of the date of this material and are subject to change without notice. Past performance is not indicative of future results. This communication is not intended as an offer or solicitation for the purchase or sale of any financial instrument. Benzinga does not provide individually tailored investment advice. Any opinions and recommendations herein do not take into account individual client circumstances, objectives, or needs and are not intended as recommendations of particular securities, financial instruments or strategies to particular clients. You must make your own independent decisions regarding any securities, financial instruments or strategies mentioned or related to the information herein. Periodic updates may be provided on companies, issuers or industries based on specific developments or announcements, market conditions or any other publicly available information. However, Benzinga may be restricted from updating information contained in this communication for regulatory or other reasons. Clients should contact analysts and execute transactions through a Benzinga subsidiary or affiliate in their home jurisdiction unless governing law permits otherwise. This communication may not be redistributed or retransmitted, in whole or in part, or in any form or manner, without the express written consent of Benzinga. Any unauthorized use or disclosure is prohibited. Receipt and review of this information constitutes your agreement not to redistribute or retransmit the contents and information contained in this communication without first obtaining express permission from an authorized officer of Benzinga. Copyright 2022 Benzinga. All rights reserved.
© 2025 Benzinga.com. Benzinga does not provide investment advice. All rights reserved.
Trade confidently with insights and alerts from analyst ratings, free reports and breaking news that affects the stocks you care about.

