Market Overview
Stocks were down again in the U.S. as bulls still have a lot to work to do in order to turn this tape around. But the bigger story continues to be the absolute dominance of international stocks compared to the U.S., and especially in countries like China, Germany, and Poland. Crypto is still struggling to sustain a bid, even with news of the strategic crypto reserve. The job market is starting to weaken as we anticipated, and this is probably going to spur the Fed into action sooner than later.
Stocks I Like
Exelixis (EXEL) – 24% Return Potential
What's Happening
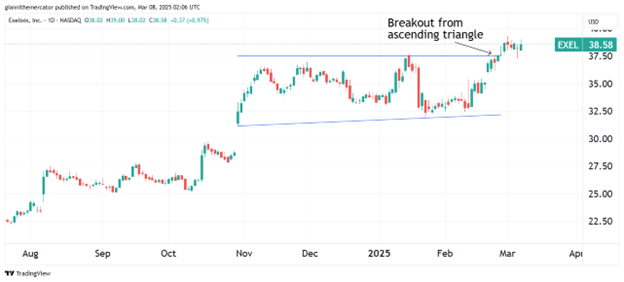
- Exelixis (EXEL) is a leading biotechnology company dedicated to delivering innovative cancer treatments, offering a diverse portfolio of therapies and research initiatives designed to improve patient outcomes and advance oncology care.
- Revenue and earnings in EXEL have fluctuated notably over the past year, but their most recent quarter showed revenue of $566.75 million and earnings of $139.86 million.
- This valuation on EXEL is fair. Its P/E is at 21.90, its Price-to-Sales is a bit higher at 5.26, and its EV to EBITDA is at 13.73.
- At a technical level, EXEL just broke out from an ascending triangle formation, so we could see a continuation of the longer-term bull trend.
Why It's Happening
- Exelixis’ crown jewel, the cabozantinib franchise, delivered a staggering $1.81 billion in U.S. net product revenues for FY 2024, including $515 million in Q4 alone. This represents significant year-over-year growth and demonstrates the drug’s expanding market penetration.
- Exelixis is gearing up for multiple pivotal data readouts for zanzalintinib in 2025. This next-generation tyrosine kinase inhibitor has shown promising results in early-stage trials and could potentially address a broader range of cancers than cabozantinib. A positive data readout could be a major catalyst for the stock.
- The Board’s authorization of a new $500 million stock repurchase program, set to begin after the completion of the current $500 million program in Q2 2025, demonstrates management’s commitment to returning value to shareholders.
- With approximately $2 billion in cash and investments as of the end of 2024, Exelixis has ample financial firepower to fund its ambitious growth plans. This strong cash position not only provides a safety net but also allows the company to pursue strategic acquisitions, accelerate R&D, or further expand its commercial infrastructure.
- Exelixis continues to expand its global reach through partnerships with companies like Ipsen and Takeda for international commercialization of cabozantinib. These collaborations not only provide additional revenue streams but also validate the global potential of Exelixis’ products.
- Analyst Ratings:
- Wells Fargo: Equal Weight
- Barclays: Equal Weight
- HC Wainwright: Buy
My Action Plan (24% Return Potential)
- I am bullish on EXEL above $32.00-$33.00. My upside target is $48.00-$50.00.
Tencent Music Entertainment (TME) – 43% Return Potential
What's Happening
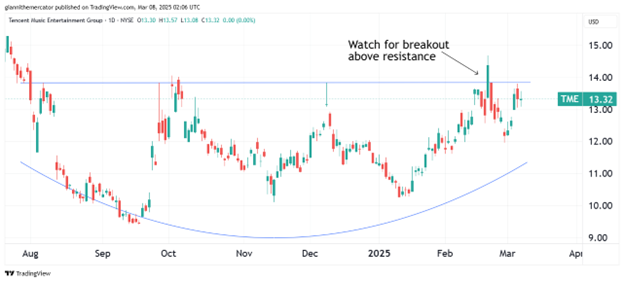
- Tencent Music Entertainment (TME) is a leading digital entertainment company focused on delivering innovative music and audio streaming services, offering a diverse portfolio of platforms and content designed to enhance user experiences and advance the online music industry.
- Revenue and earnings for TME have been solid. In the last quarter, they reported $7.01 billion in revenue and $1.58 billion in earnings.
- Valuations are solid in this name. P/E is at 23.53, Price-to-Sales is high at 5.06, and EV to EBITDA is at 16.34.
- From a technical perspective, TME is looking to breakout from a saucer pattern. If it clears resistance, look out above.
Why It's Happening
- Tencent Music reported a 35.7% return over the past year, indicating robust demand for its services amidst a competitive landscape. This growth trajectory is expected to continue as the company prepares to release its Q4 and full-year 2024 financial results on March 18, 2025. Analysts anticipate that positive results will further validate TME’s growth strategy, potentially driving the stock price higher as investor confidence builds.
- The upcoming launch of the Bubble service on QQ Music, in partnership with SM Entertainment’s Dear U, promises to enhance artist-fan interactions through exclusive content and direct communication. This innovation not only differentiates TME from competitors but also strengthens user engagement, which is critical in retaining subscribers and driving revenue growth.
- TME operates multiple popular platforms, including QQ Music, Kugou Music, Kuwo Music, and WeSing, which collectively cater to various segments of the music market. This diversification helps mitigate risks associated with reliance on a single revenue source.
- TME's collaboration with major entertainment entities like SM Entertainment positions it well within the music industry. Such partnerships not only enhance its content library but also provide access to a broader audience base. The strategic alliances can lead to exclusive releases and promotional events that drive user engagement and subscription growth, ultimately boosting revenue.
- TME is actively exploring AI-driven technologies to enhance user experience across its platforms. By integrating advanced algorithms for personalized recommendations and content curation, TME can increase user satisfaction and retention rates. As technology continues to shape consumer preferences in entertainment, TME’s proactive approach positions it well for future growth.
- With a current ratio of 2.26 and a minimal debt-to-equity ratio of 0.06, Tencent Music demonstrates strong financial health. These metrics indicate that TME is well-positioned to manage its short-term obligations while having ample room for growth investments.
- Analyst Ratings:
- Morgan Stanley: Overweight
- Barclays: Overweight
- Bernstein: Outperform
My Action Plan (43% Return Potential)
I am bullish on TME above $11.00-$12.00. My upside target is $19.00-$20.00.
Rocket Companies (RKT) – 27% Return Potential
What's Happening
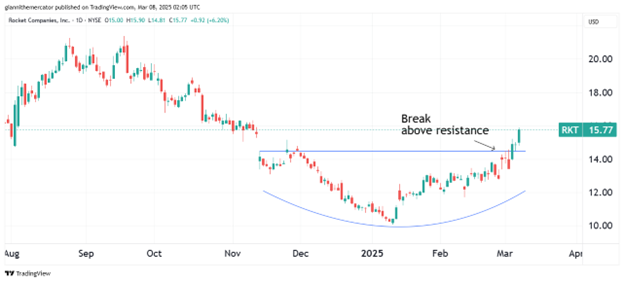
- Rocket Companies (RKT) is a prominent financial technology company focused on delivering innovative mortgage and real estate solutions, offering a diverse portfolio of services designed to streamline homeownership and enhance client experiences in the lending industry.
- The mortgage lender's revenue has been steady over the past year despite a struggling real estate market. Its latest revenue was $1.19 billion, while its earnings were $33.87 million.
- Its valuation is very steep. Its P/E is at 66.95, its Price-to-Sales is low at 0.40, and its Book Value is at 4.81.
- From a charting view, RKT is breaking out from a rounding bottom formation. If it sticks, it could lead to a new bull market in this stock.
Why It's Happening
- RKT’s strategic focus on AI-driven operations is paying off big time, with adjusted EBITDA margin skyrocketing to 18% in Q4 2024, up from just 2% the previous year. This massive profitability boost showcases Rocket’s ability to leverage technology for operational excellence.
- Rocket Mortgage’s net rate lock volume surged 47% year-over-year to $23.6 billion in Q4 2024, significantly outpacing industry growth. This market share gain positions RKT as a dominant force in the mortgage sector, especially crucial as the housing market shows signs of recovery.
- RKT’s servicing portfolio has grown to an impressive $593 billion in unpaid principal balance, up 17% year-over-year. This expansion not only provides a stable revenue stream but also offers cross-selling opportunities for Rocket’s suite of financial products. As the servicing portfolio continues to grow, it will act as a natural hedge against interest rate fluctuations and provide valuable customer data for targeted marketing initiatives.
- Despite industry headwinds, Rocket has successfully expanded its purchase market share, demonstrating the company’s resilience and adaptability. This achievement is particularly impressive given the current challenges in housing affordability.
- Rocket Companies delivered a jaw-dropping 34% year-over-year increase in Q4 2024 adjusted revenue, reaching $1.2 billion.
- With $2.9 billion in available cash and $8.2 billion in total liquidity, Rocket Companies is well-positioned to weather economic uncertainties and capitalize on growth opportunities. This financial strength allows RKT to invest in technology, pursue strategic acquisitions, and return value to shareholders through potential buybacks or dividends.
- Analyst Ratings:
- JP Morgan: Underweight
- UBS: Neutral
- Goldman Sachs: Neutral
My Action Plan (27% Return Potential)
- I am bullish on RKT above $11.80-$12.00. My upside target is $20.00-$21.00.
Market-Moving Catalysts for the Week Ahead
Unemployment, Not Inflation, is the Concern
We're finally starting to see some cracks in the labor market after years of resiliency. This is showing up in the data as the DOGE (Department of Government Efficiency) cuts rip through the federal workforce.
The big concern here is the private sector's ability (or lack thereof) to absorb all these new individuals. But another overlooked detail about this labor market transformation is how it's likely to cause the Fed to cut rates even sooner than previously thought.
With inflation all but under control (thank you dropping oil prices), the odds of a Fed rate cut for May has turned into a toss-up. The rally in long-term bonds has flattened the yield curve, so the Fed will be keen on re-steepening it as soon as possible. The way to do that is by cutting short-term rates.
Don't Let Recency Bias Hold You Back
It's been over a decade since traders and investors have been meaningfully rewarded by seeking opportunities abroad. In other words, market participants in the U.S. have been spoiled, but as a global geopolitical realignment is taking place, it's playing out in markets too.
Two of the strongest big markets year-to-date include Germany and China. Personally, I think China has better tradable opportunities, but European stocks are enjoying their biggest run of outperformance against U.S. stocks in years.
I think 2025 will be a year to trade and invest abroad if you're looking to outperform the S&P. To be clear, I think U.S. stocks will have a decent year, but it will be far from a blowout market to the upside. This is going to frustrate both bulls and bears in this tape.
Sector & Industry Strength
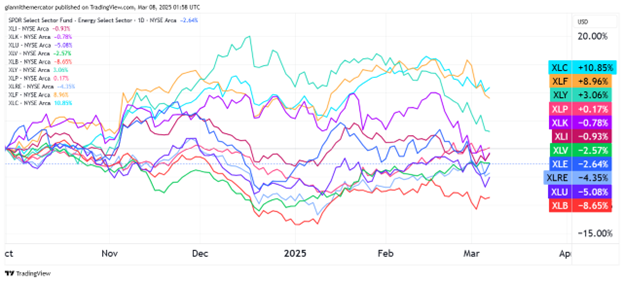
With only a handful of sectors in positive territory since the start of Q4 2024, the weight of the evidence is still pointing towards this pullback in stocks being corrective in nature versus the start of a new bear trend.
Based on how these sectors are trading, the market doesn't seem at all concerned with inflation. When you have basic materials (XLB), energy (XLE), and industrials (XLI) all in negative territory over the past 5 months, price pressures simply aren't to the upside.
The big blunder in this tape continues to be tech (XLK). It's hard for U.S. stocks to rally when its largest and most important sector is down over the past 5 months. But with rates set to come down, I'm looking for a big-time bottom here in the near-future.
| 1 week | 3 Weeks | 13 Weeks | 26 Weeks |
| Materials | Healthcare | Healthcare | Communications |
Editor's Note: Healthcare and materials were actually tied for the one-week leader, but healthcare is reasserting itself here, which isn't exactly what the bulls want to see.
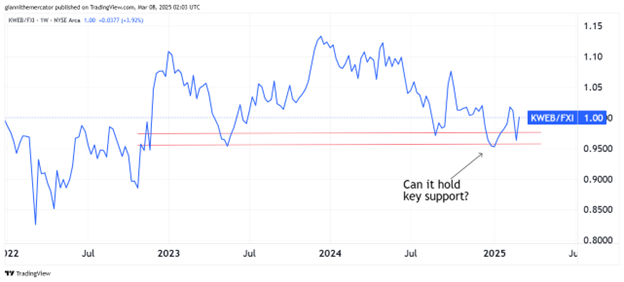
Concentration on China (Sector ETF: KWEB/FXI)
The Chinese equity theme we've been highlighting in this report over the past several weeks continues to play out. We're seeing Chinese stocks press up into their multi-year highs while U.S. stocks over around multi-year lows.
Now we need to hone in on what sectors in China may do best, and at the top of our list is internet stocks. This chart looks at the ratio between Chinese internet stocks (KWEB) and large cap Chinese stocks (FXI).
Over the past year or so, FXI has done better, but now that the ratio is bouncing off key support, we're looking at a shift in capital flows. I wouldn't be surprised if Chinese internet names emerged as the leader in a new Chinese bull market.
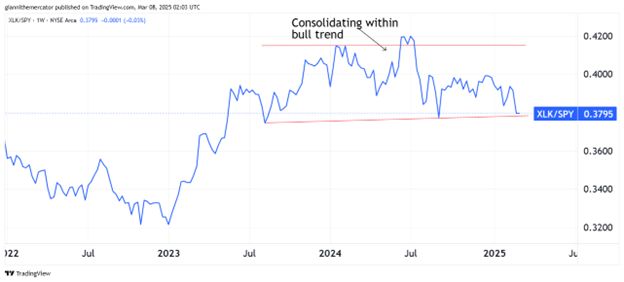
Live by Tech, Die by Tech (Sector ETF: XLK/SPY)
It's no secret that the U.S. equity market is dominated by the tech sector. Unfortunately for market bulls, tech has struggled to reestablish its leadership over the past several months, which is highlighted in the ratio below (XLK/SPY).
Basically, when this line rises, it means tech is outperforming the index. When it falls, it means tech is lagging. The market tends to be more risk-on when tech is a top-performer, as it goes with the idea that a rising tide lifts all boats.
Since August 2023, this ratio has been consolidating within an ascending triangle pattern. The ratio is bouncing off support now, so we could see a bounce here. The last thing stock bulls want to see is a break below the lower trendline of the pattern. In time, it would be ideal to see it breakout to the upside.
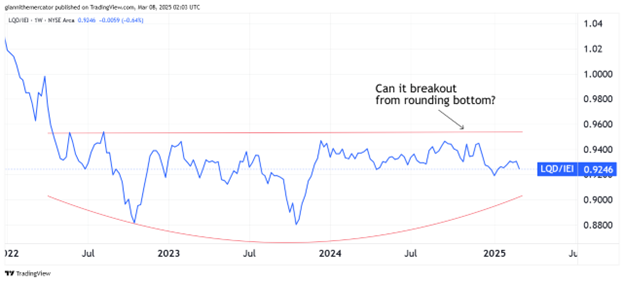
What Will it Take for Spreads to Breakout? (Sector ETF: LQD/IEI)
We've been tracking the bond market's credit spreads here in the Insider Report for years. I like to use investment-grade corporate debt (LQD) against 3-7 Year Treasuries (IEI) as the proxy. Remember, it's a good sign when Treasuries underperform. After all, they are the "risk free" asset.
There are a lot of changes taking place in Washington and specifically in the federal budget. This is having a major impact on bond markets, as we've seen Treasuries stage one of their best rallies in months. Fortunately, corporate debt (LQD) has held its own, but I would like to see improvement.
It looks like the Fed's timetable on rate cuts is starting to move up, and May is now a toss up. I wouldn't be surprised to see the next rate cut as a catalyst for this ratio to finally breakout above the upper horizontal trendline of the rounding bottom.
My Take:
The tariff tantrums are serving their purpose. It's creating fear and hysteria surrounding the economy, and leading to hasty and abrupt behaviors in the markets. Fear levels are very high and the market is looking for the Fed to save them.
With the risk of unemployment on the rise, I think the Fed will step in and start cutting rates sooner than later. Not only will this help certain sectors in the market regain their mojo (like tech), but it will also help reinvigorate the real estate market.
I think that we are on the cusp of the first exciting real estate season since 2021. The housing market started to slow down quite a bit in 2022, and it's been frozen ever since. I would look for that to change sometime this year.
Cryptocurrency
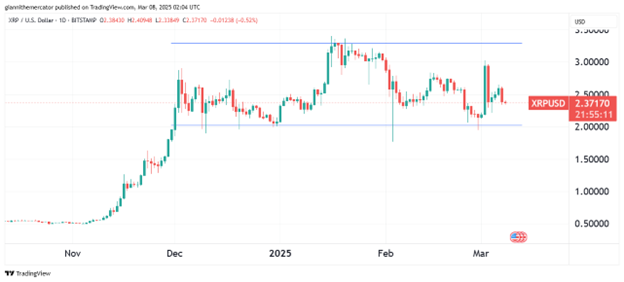
XRP has reached a critical technical juncture as it tests the substantial support level around $2.00, which has proven to be a key floor since December. This price action is particularly noteworthy given that we’re seeing a confluence of technical factors: the horizontal support that has held multiple times since late 2024 and the recent pullback from the January peak.
As price approaches the intersection of this descending resistance and horizontal support around $2.00, we’re seeing the formation of a descending triangle with decreasing volatility – often a precursor to a significant move.
The technical structure becomes even more favorable when considering the magnitude of XRP’s rally from November (rising from $0.60 to over $3.40), which suggests this current correction is healthy profit-taking rather than a trend reversal. However, traders should remain vigilant – a sustained break below the $2.00 support would invalidate this bullish thesis and potentially signal a deeper retracement toward the $1.60-1.80 range.
Legal Disclosures:
This communication is provided for information purposes only.
This communication has been prepared based upon information, including market prices, data and other information, from sources believed to be reliable, but Benzinga does not warrant its completeness or accuracy except with respect to any disclosures relative to Benzinga and/or its affiliates and an analyst’s involvement with any company (or security, other financial product or other asset class) that may be the subject of this communication. Any opinions and estimates constitute our judgment as of the date of this material and are subject to change without notice. Past performance is not indicative of future results. This communication is not intended as an offer or solicitation for the purchase or sale of any financial instrument. Benzinga does not provide individually tailored investment advice. Any opinions and recommendations herein do not take into account individual client circumstances, objectives, or needs and are not intended as recommendations of particular securities, financial instruments or strategies to particular clients. You must make your own independent decisions regarding any securities, financial instruments or strategies mentioned or related to the information herein. Periodic updates may be provided on companies, issuers or industries based on specific developments or announcements, market conditions or any other publicly available information. However, Benzinga may be restricted from updating information contained in this communication for regulatory or other reasons. Clients should contact analysts and execute transactions through a Benzinga subsidiary or affiliate in their home jurisdiction unless governing law permits otherwise.
This communication may not be redistributed or retransmitted, in whole or in part, or in any form or manner, without the express written consent of Benzinga. Any unauthorized use or disclosure is prohibited. Receipt and review of this information constitutes your agreement not to redistribute or retransmit the contents and information contained in this communication without first obtaining express permission from an authorized officer of Benzinga. Copyright 2022 Benzinga. All rights reserved.
© 2025 Benzinga.com. Benzinga does not provide investment advice. All rights reserved.
Trade confidently with insights and alerts from analyst ratings, free reports and breaking news that affects the stocks you care about.

