Market Overview
The selling in stocks continued last week despite a short covering rally on Friday. The Dow Jones Industrial Average lead the rout finishing 3.07% lower. The Nasdaq and S&P 500 followed, each finishing down 2.43% and 2.27%, respectively. There continues to be concerns about the markets internals from a leadership standpoint, even though there was some improvement in breadth towards the end of the week. Precious metals continue to exhibit the strongest uptrend in this market, and China's outperformance is showing no signs of slowing down.
Stocks I Like
Zai Lab (ZLAB) – 41% Return Potential
What's Happening
- Zai Lab (ZLAB) is a leading Chinese biotechnology company committed to delivering innovative cancer treatments, providing a diverse portfolio of therapies and research initiatives aimed at enhancing patient outcomes and advancing oncology care.
- Revenue has been trending in the right direction for this company, but it's still reporting losses. In its most recent quarter, revenue came in at $109.07 million but they still lost $81.68 million on the year.
- This valuation on ZLAB is high. Price-to-Sales is at 8.96 and its Book Value is just 7.76.
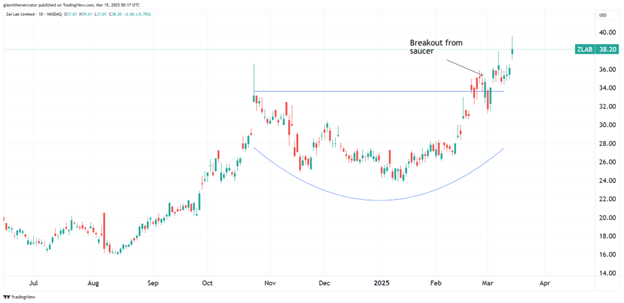
- At a technical level, ZLAB just broke out from a saucer formation and looks to be accelerating to the upside in terms of momentum.
Why It's Happening
- Zai Lab has announced plans to achieve non-GAAP profitability by Q4 2025. This milestone is supported by a robust product pipeline and expanding revenue streams, particularly from its flagship VYVGART franchise. The company's focus on cost management, evidenced by a 45% reduction in operating losses in Q4 2024, underscores its commitment to financial discipline while scaling operations.
- The VYVGART franchise generated $93.6 million in net product revenue during its first full launch year, highlighting strong market adoption. Additionally, upcoming launches like KarXT for schizophrenia and bemarituzumab for gastric cancer are poised to drive significant revenue growth.
- Early clinical data from the global Phase 1 trial of ZL-1310 (DLL3 ADC) showed an impressive objective response rate (ORR) of 74% in small cell lung cancer (SCLC). This first-in-class asset holds the potential to revolutionize treatment paradigms for neuroendocrine tumors.
- Analysts project that Zai Lab will achieve $2 billion in annual revenue by 2028, driven by its expanding portfolio of blockbuster drugs and innovative therapies. This long-term growth potential significantly enhances the stock's intrinsic value and makes it an attractive option for growth-oriented investors.
- Zai Lab's active engagement with the investment community through events like the Leerink Partners Global Healthcare Conference and Jefferies Biotech on the Beach Summit underscores management's transparency and commitment to shareholder engagement.
- Zai Lab reported an impressive 66% year-over-year revenue growth for Q4 2024, reaching $109.1 million, and a full-year growth of 50%, totaling $399 million.
- Analyst Ratings:
- JP Morgan: Overweight
- Scotiabank: Sector Outperform
- B of A Securities: Neutral
My Action Plan (41% Return Potential)
- I am bullish on ZLAB above $34.00-$35.00. My upside target is $54.00-$55.00.
TG Therapeutics (TGTX) – 35% Return Potential

What's Happening
- TG Therapeutics (TGTX) is a leading biotechnology company focused on delivering innovative cancer treatments, offering a diverse portfolio of therapies and research initiatives designed to improve patient outcomes and advance oncology care.
- Revenue and earnings for TGTX continue to move in the right direction, as they are steadily increasing. The latest report showed revenue at $108.19 million in the last quarter, while earnings were at $23.33 million.
- Valuations are sky-high in TGTX. P/E is at 247.06, Price-to-Sales is at 18.06, and EV to EBITDA is at 115.50 – Wall Street has high hopes for this stock.
- From a technical viewpoint, TGTX just broke out from a broadening wedge formation. These are powerful momentum patterns and one of my favorites to trade on the long side of the market.
Why It's Happening
- TG Therapeutics has been added to the IBD Leaderboard and ranked among the IBD 50 Top 10 Growth Stocks. These accolades underscore its strong price performance and bullish technical indicators, further validating its potential as a top-tier investment opportunity.
- Analysts at B. Riley recently raised their price target for TGTX from $38 to $53 while maintaining a “Buy” recommendation. This bullish outlook is based on the company’s impressive financial results and growth prospects, signaling confidence among institutional investors.
- BRIUMVI has received regulatory approvals in Europe and the UK. International expansion provides access to untapped markets, significantly increasing the addressable patient population and driving incremental revenue growth.
- TG Therapeutics achieved a gross margin of 88.3%, showcasing operational efficiency. Strong margins enable the company to reinvest in R&D while maintaining profitability, which is crucial for sustaining long-term growth.
- TG Therapeutics reported $310 million in U.S. net revenue for BRIUMVI in 2024, surpassing initial expectations.
- Analyst Ratings:
- Morgan Stanley: Overweight
- Barclays: Overweight
- Bernstein: Outperform
My Action Plan (35% Return Potential)
I am bullish on TGTX above $34.00-$35.00. My upside target is $55.00-$56.00.
Chevron (CVX) – 37% Return Potential

What's Happening
- Chevron (CVX) is a leading energy company committed to delivering innovative solutions, offering a diverse portfolio of products and research initiatives aimed at advancing energy production and sustainability efforts worldwide.
- The oil producer is a revenue and earnings powerhouse that has still managed to grow its bottom line despite volatility in energy prices. Its recent quarterly report showed revenue of $52.23 billion and earnings of $3.24 billion.
- Its valuation is very much on sale. Its P/E is at 15.80, its Price-to-Sales is at 1.44, and its EV to EBITDA is at 6.44.
- From a charting standpoint, CVX has built a beautiful technical base within a saucer formation. If it clears the upper horizontal trendline, look for a big breakout higher to new records.
Why It's Happening
- In 2024, Chevron increased its worldwide production by 7% and U.S. production by an impressive 19%, reaching record levels. The company's ability to scale production efficiently demonstrates its operational excellence and positions it well to capitalize on rising global energy demand.
- Chevron is prioritizing growth in the Gulf of Mexico, aiming to boost production from 200,000 barrels per day (bpd) to 300,000 bpd. Additionally, it is nearing the milestone of producing 1 million bpd in the Permian Basin, the most prolific U.S. oil field. These high-return domestic assets are expected to generate significant free cash flow, enhancing long-term profitability.
- Despite recent policy reversals affecting its Venezuelan operations, Chevron remains focused on leveraging stable U.S. energy policies for long-term growth. CEO Mike Wirth's advocacy for consistent regulatory frameworks underscores the company's strategic foresight in navigating geopolitical risks while maximizing returns from domestic projects.
- Chevron has achieved key milestones in major projects like the Future Growth Project in Kazakhstan and other U.S.-based initiatives. These advancements not only expand production capacity but also align with global trends toward sustainable energy solutions, potentially attracting ESG-focused investors.
- Chevron returned a record $27 billion to shareholders in 2024 through dividends and share buybacks, showcasing its commitment to rewarding investors. This substantial return reflects the company's strong cash flow and disciplined capital allocation, which are critical drivers of shareholder value. With a dividend yield of 4.37% and a recent 5% increase in quarterly payouts, Chevron offers both income stability and growth potential
- With a forward price-to-earnings (P/E) ratio of 14.73 and an enterprise value-to-EBITDA ratio of 7.54, Chevron is attractively valued compared to industry peers.
- Analyst Ratings:
- Barclays: Overweight
- Truist Securities: Hold
- UBS: Buy
My Action Plan (37% Return Potential)
- I am bullish on CVX above $139.00-$140.00. My upside target is $215.00-$220.00.
Market-Moving Catalysts for the Week Ahead
The Fed is Only Buying Time
Well, my suspicion that inflation was a non-factor in this current economy was confirmed last week. To be clear – this doesn't mean inflation has disappeared, it's just not increasing or accelerating to the upside like it was a couple years ago.
This gives the Fed wiggle room to lower rates, and I think they will need to do so sooner rather than later. But my bigger concern remains on the employment front, especially when it comes to the job cuts in the public sector.
It's important to remember that job cuts are more likely to mean rate cuts. We're on the cusp of an economic slowdown, but I am not convinced it will lead to a full-blown recession. There's no doubt that a global realignment of capital is taking place, however.
Know When to Hold ‘Em, Know When to Fold ‘Em…
It's absolutely key to recognize as a trader or investor what type of market environment where in, and which strategies work best. For those that are more long-term oriented investors, this pullback is a dip-buying opportunity. You can't be as concerned with nailing the absolute low.
If you're a trader, your positions are a bit more aggressive, so it's critical to remain nimble. Short-term swing trades seem to be working best right now, especially ones that can capitalize on short squeezes. We're seeing some big moves in short periods of time – stay nimble.
In terms of a full-blown bear market that leads to a recession, I think it's rather unlikely. Remember I'm one of those that believes we had a recession in 2022 contrary to the conventional narrative at the time. Fear levels are high right now, which could give us a setup for a nice rally to begin here at any time. The key, of course, is where the next high comes in.
Sector & Industry Strength

The tape is still evolving in a mixed manner here. Going back to the start of Q4 2024 now, the only two sectors in positive territory are financials (XLF) and communications (XLC). These aren't bearish in of itself, but we need more participation.
The energy sector (XLE) is now basically flat over the past six months. This could signal that the market is starting to seriously consider another round of money printing by the central bank. Close behind, there's consumer discretionary (XLY) and technology (XLK).
At the bottom of the pack, we still see more defensive sectors like consumer staples (XLP) and healthcare (XLV). This is despite these two sectors doing some of the strongest numbers year-to-date. The key is whether this recent trend is sustained. If so, it's bearish.
| 1 week | 3 Weeks | 13 Weeks | 26 Weeks |
| Energy | Utilities | Utilities | Communications |
Editor's Note: Seeing energy and utilities claiming leadership rankings is not the most bullish sign.
Gold's Time to Shine (Sector ETF: GLD/SPY)
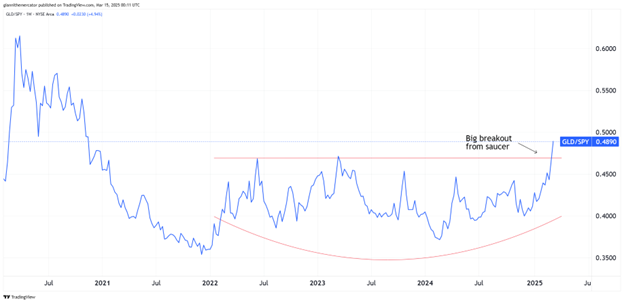
It would appear that the next phase of the great gold (GLD) bull market is upon us, especially when we compare the shiny metal against the S&P 500 (SPY). Let's check in on the ratio between these two asset classes if tells an even bigger story.
Note how the ratio bottomed early in 2024 and began trending higher ever since. Both of these asset classes put in strong returns in 2024, but gold did slightly edge out stocks last year. And with the volatility we're seeing in equities to start 2025, this outperformance is kicking into hyper-drive.
The breakout from the saucer formation here carries major implications. It tells us that even if stocks recover from the recent selling, gold remains a stronger candidate to outperform to the upside. It's becoming irresponsible to not have an allocation to metals within one's portfolio.
Mind Those Miners (Sector ETF: GDX/XLK)
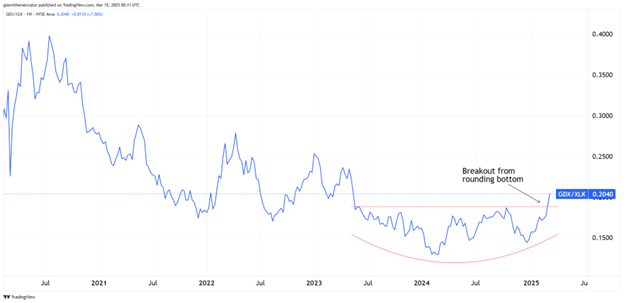
I want to dive even deeper on just how significant this shift between metals and stocks is. We're now looking at the ratio between gold miners (GDX) and tech stocks (XLK). The significance of these two ratios is key for those seeking to outperform the benchmarks.
When precious metal bull runs take hold, mining stocks will typically outperform the spot price of metals. And in bull markets for stocks, we typically see the tech sector outperform the index to the upside too.
So, when we're seeing gold mining stocks outperform the tech sector, it represents a significant shift in the market's economic expectations. The breakout from the rounding bottom formation signals this move is early. It appears that it's time to overweight miners and underweight tech, at least compared to one another.
Bond Market Confirming Our Inflation Suspicions? (Sector ETF: TIP/IEF)
After last week's inflation data that showed the pressures in price increases are evaporating or basically non-existent, it would be wise to check back in on what the bond market is saying. After all, markets are forward-looking while economic data is backward looking.
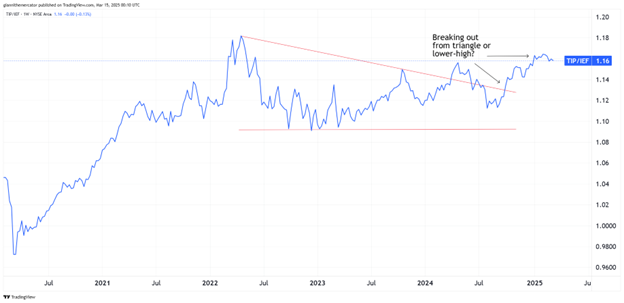
I like to use the ratio between Treasury Inflation Protected Securities (TIP) and 7-10 Year Treasuries (IEF). When TIP outperforms and the ratio rises, it means inflation expectations are rising, but when IEF outperforms and the ratio drops, it means the market isn't concerned with inflation.
We've seen a potential lower-high form after what appeared to be a breakout from a descending triangle formation. If we want to see rates drop, then we need to see this lower-high hold, and especially if we want to see the Fed cut rates again, which I think they will.
My Take:
There's been a lot of talk lately about whether the Trump Administration wants to intentionally cause the economy to slow in order to force the Fed's hand on lowering rates. I think there is some merit to this.
However, the focus has been on the tariff and government spending side of the equation. These may not help the economic picture in the immediate-term, but we also can't rule out the positive impact that tax cuts may have in the near future either.
Then there is the falling dollar part of the equation. Once upon a time, it was inflationary, but not anymore. We're in a new paradigm where the dollar is impacted more by interest rate direction than anything else. If rates go up, the dollar follows, if down, the dollar follows.
Cryptocurrency
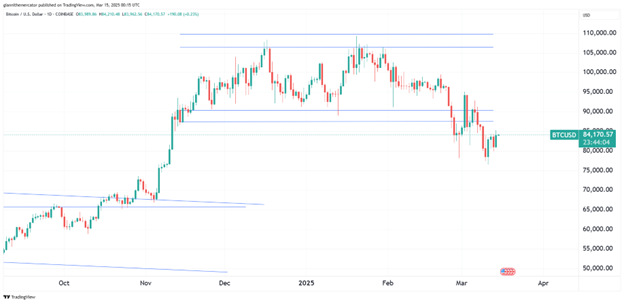
Bitcoin has reached a critical technical juncture as it bounced strongly off the $75,000-76,000 support level – a price point that marks the breakout zone from late October 2024. This powerful reaction at support suggests significant buying interest has emerged at these levels, creating what could be a meaningful higher low in the broader uptrend.
What makes this setup particularly compelling is the context of the recent pullback. After reaching all-time highs around $108,000, Bitcoin has undergone a healthy correction of approximately 30% – a magnitude consistent with previous bull market pullbacks before continuation.
Looking ahead, the technical structure remains favorable as long as Bitcoin maintains support above the $75,000-76,000 level. The current price action, with its strong bullish engulfing candle, suggests momentum may be shifting back to the upside after weeks of downward pressure. First resistance appears around the $88,000-90,000 zone, with potential for a move back toward $100,000 if bullish momentum builds.
Legal Disclosures:
This communication is provided for information purposes only.
This communication has been prepared based upon information, including market prices, data and other information, from sources believed to be reliable, but Benzinga does not warrant its completeness or accuracy except with respect to any disclosures relative to Benzinga and/or its affiliates and an analyst’s involvement with any company (or security, other financial product or other asset class) that may be the subject of this communication. Any opinions and estimates constitute our judgment as of the date of this material and are subject to change without notice. Past performance is not indicative of future results. This communication is not intended as an offer or solicitation for the purchase or sale of any financial instrument. Benzinga does not provide individually tailored investment advice. Any opinions and recommendations herein do not take into account individual client circumstances, objectives, or needs and are not intended as recommendations of particular securities, financial instruments or strategies to particular clients. You must make your own independent decisions regarding any securities, financial instruments or strategies mentioned or related to the information herein. Periodic updates may be provided on companies, issuers or industries based on specific developments or announcements, market conditions or any other publicly available information. However, Benzinga may be restricted from updating information contained in this communication for regulatory or other reasons. Clients should contact analysts and execute transactions through a Benzinga subsidiary or affiliate in their home jurisdiction unless governing law permits otherwise.
This communication may not be redistributed or retransmitted, in whole or in part, or in any form or manner, without the express written consent of Benzinga. Any unauthorized use or disclosure is prohibited. Receipt and review of this information constitutes your agreement not to redistribute or retransmit the contents and information contained in this communication without first obtaining express permission from an authorized officer of Benzinga. Copyright 2022 Benzinga. All rights reserved.
© 2025 Benzinga.com. Benzinga does not provide investment advice. All rights reserved.
Trade confidently with insights and alerts from analyst ratings, free reports and breaking news that affects the stocks you care about.