

Market Overview
It was another wild week for stocks, which started off rallying, only to sell off into Friday. But a torrid, late-day rally on Friday allowed stocks to finish in positive territory, with the Dow Jones Industrial Average leading the way higher. It finished up 1.20%, while the S&P 500 and Nasdaq lagged behind, finishing up 0.51% and 0.17%, respectively. The "reflation trade" is starting to accelerate, and energy is running the table against other sectors. This raises some concerns in the near-term as we need to see market internals improve before stocks can resume their longer-term bull trend.
Stocks I Like
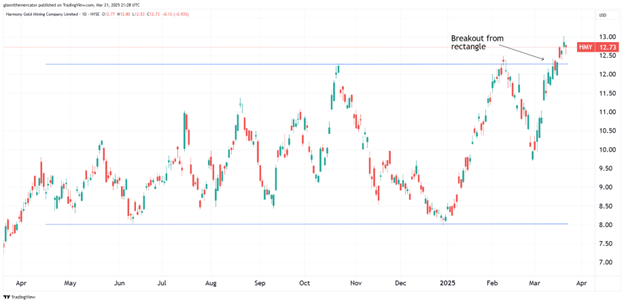
Harmony Gold Mining HMY +34% Return Potential
What's Happening
- Harmony Gold Mining Company (HMY) is a leading South African gold mining company committed to delivering gold production and providing a diverse portfolio of mining operations.
- The company's results are starting to trend in the right direction as it's been increasing its revenue in recent quarters. The latest one showed revenue of $4.57 billion, and more importantly, it was their first quarter with earnings, which came in at $76 million.
- This valuation on HMY is very strong. P/E is at 13.42, Price-to-Sales is at 2.10, and EV to EBITDA is at 6.49.
- At a technical level, HMY looks to be starting a breakout from a rectangle pattern, which implies a continuation of its uptrend is underway.
Why It's Happening
- HMY’s underground recovered grades increased to 6.4 grams per tonne, surpassing full-year guidance. This exceptional performance demonstrates the company’s operational efficiency and ability to extract high-quality ore.
- All-in sustaining costs remained well-controlled at ZAR 972,000 per kilogram.. This cost efficiency is crucial in the mining industry, as it directly impacts profit margins. With HMY maintaining tight cost controls, the company is well-positioned to capitalize on rising gold prices, potentially leading to expanded profit margins and increased shareholder value.
- Recent geopolitical tensions have brought gold back into the spotlight as a safe-haven asset. This renewed interest in gold could drive up prices, benefiting gold mining companies like HMY. As global uncertainties persist, HMY’s stock could see increased demand from investors seeking exposure to the precious metals sector.
- The company has announced a new mining site potentially rich in high-grade ore. This development could significantly boost HMY’s production capacity and revenue in the coming quarters.
- HMY is exploring collaborative ventures in renewable energy. This forward-thinking approach could lead to reduced operational costs and improved environmental sustainability.
- The operating free cash flow margin has expanded to 29%, reflecting the company’s investment in quality ounces and favorable gold prices. This margin expansion showcases HMY’s ability to capitalize on market conditions and operational improvements.
- The company reported stellar interim results, with group production reaching 800,000 ounces for the first half of the fiscal year.
- Analyst Ratings:
- JP Morgan: Neutral
- HSBC: Reduce
My Action Plan (34% Return Potential)
- I am bullish on HMY above $10.50-$11.00. My upside target is $17.00-$18.00.
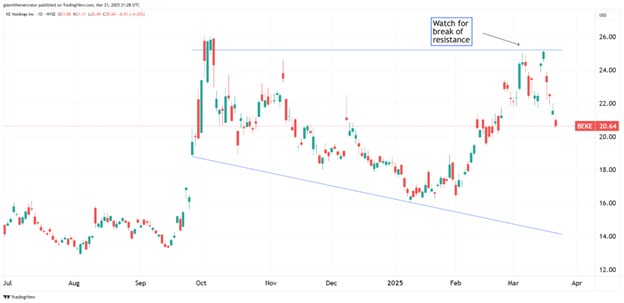
KE Holdings BEKE +70% Return Potential
What's Happening
- KE Holdings Inc. (BEKE) is a leading Chinese real estate technology company committed to delivering innovative housing solutions, providing a diverse portfolio of digital platforms and services aimed at enhancing customer experiences and advancing the real estate market.
- Revenue and earnings for have started to trend in the right direction again. The latest results showed quarterly revenue at $31.13 billion and earnings at $569.99 million.
- Valuations are elevated in BEKE. P/E is at 47.58, Price-to-Sales at 2.41, and EV to EBITDA at 34.30.
- From a technical perspective, a break above resistance from the broadening wedge formation could lead to another leg higher in BEKE.
Why It's Happening
- With Tencent holding an 8% voting power in BEKE, the company benefits from the support and potential strategic partnerships with one of China’s leading tech giants. This backing not only provides financial stability but also opens doors for technological collaborations and innovations.
- Analysts forecast an impressive 20.9% annual earnings growth for BEKE, along with a substantial 26.7% increase in EPS. These projections underscore the company’s strong growth potential and ability to generate increasing profits.
- BEKE’s unique approach combining digital platforms with physical stores has revolutionized real estate transactions in China. This integrated model provides a seamless and efficient experience for customers, setting BEKE apart from traditional competitors.
- BEKE’s successful acquisition of Shengdu Home Decoration in 2022 has allowed the company to expand its service offerings and create additional revenue streams. This strategic move positions BEKE as a one-stop-shop for all aspects of home buying and living, enhancing customer experience and loyalty.
- The company’s board of directors has approved a final cash dividend of US$0.12 per ordinary share, or US$0.36 per ADS, totaling approximately US$0.4 billion.
- The company’s GTV for existing home transactions reached RMB2,246.5 billion (US$307.8 billion), marking a significant 10.8% increase compared to the previous year.
- Analyst Ratings:
- Barclays: Overweight
- B of A Securities: Buy
- Citigroup: Buy
My Action Plan (70% Return Potential)
I am bullish on BEKE above $20.00-$21.00. My upside target is $36.00-$37.00.
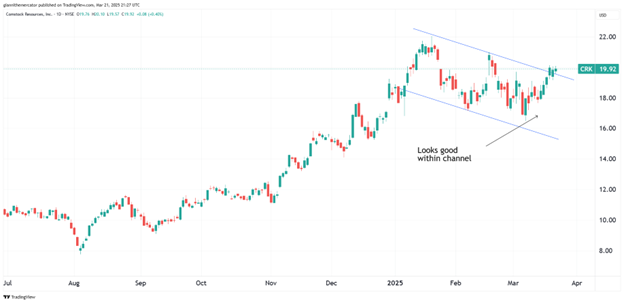
Comstock CRK +50% Return Potential
What's Happening
- Comstock Resources, Inc. (CRK) is a leading American energy company committed to delivering sustainable natural gas production, providing a diverse portfolio of exploration and development initiatives aimed at enhancing energy supply and advancing the oil and gas industry.
- The latest quarterly results showed revenue ticking higher, reaching up to $366.51 million. But the company still reported a loss of $58.13 million.
- Valuation in CRK is rather elevated. Price-to-Sales is at 4.43, Book Value is at 7.65, and EV to EBITDA is at 13.61.
- From a charting standpoint, CRK is correcting within a price channel. This suggests that a continuation of the uptrend is in the works.
Why It's Happening
- The company plans to ramp up from five to seven operating drilling rigs this year, signaling confidence in market conditions and potential for increased production. This expansion, particularly in the promising Western Haynesville play, could lead to significant output growth and improved financial performance in the coming quarters.
- Comstock recently added over 64,000 net acres in this play, bringing its total acreage to an impressive 518,000 net acres. This expansion provides ample runway for future growth and positions the company as a dominant player in one of the most productive natural gas regions in the United States.
- Comstock plans to invest $1.0 billion to $1.1 billion in development and exploration projects this year, including drilling 46 operated horizontal wells. This substantial investment underscores management’s optimism about the company’s prospects and could drive meaningful production growth in the coming years.
- The company plans to spend $130 million to $150 million on its Western Haynesville midstream system in 2025. This strategic investment, funded by its midstream partnership, should help optimize gas transportation and processing, potentially leading to improved margins and increased profitability.
- In Q4 2024, gas services revenue reached $78.2 million, substantially exceeding the estimate of $49.6 million. This diversification of revenue streams adds stability to the company’s financial profile and could provide a cushion against volatility in commodity prices.
- The company generated $222.8 million in operating cash flow in Q4 2024, significantly exceeding analyst expectations of $145.6 million.
- Analyst Ratings:
- Truist Securities: Hold
- Morgan Stanley: Equal-Weight
- Mizuho: Neutral
My Action Plan (50% Return Potential)
- I am bullish on CRK above $15.50-$16.00. My upside target is $30.00-$31.00.
Market-Moving Catalysts for the Week Ahead
The End of QT is in Sight
The Fed knows – the risks of an economic slowdown is rising, although I have doubts still that it will transform into a full-blown recession. I'll share more on this below with one of our key ratio indicators.
But with the end of QT in sight, and more rate cuts coming down the pipeline, we have the potential to offset some of the economic damage in the near-term. The net effect could lead to the market continuing to spin its wheels.
Sentiment about the market and from consumers overall is very low. This is a classical contrarian signal, but the stock market still has technical issues, especially if it keeps making lower-lows and lower-highs. This is not a time to force the issue on the long side in the short-term. But for those with a longer-term horizon, this pullback is a major opportunity already.
Managing Risk Around a Global Realignment
The market volatility to start the year caught many traders off-guard. Interestingly, the market internals didn't start to deteriorate seriously until about mid-February, but that's when the S&P 500 peaked.
The performance spread between the U.S. market and international markets is very wide. At some point, I expect it to narrow again, as we've now seen a lot of institutional money start chasing the international trend.
But I don't think is a trend (international outperforming domestic) that's going to go away anytime soon. The U.S. has dominated international stocks for a very long time. It's going to take a while before this trend can rebalance. In the meantime, expect volatility to stay elevated in the U.S – and remember, it's more important to make money than be right – stay nimble in this tape. Cash is a legitimate position.
Sector & Industry Strength
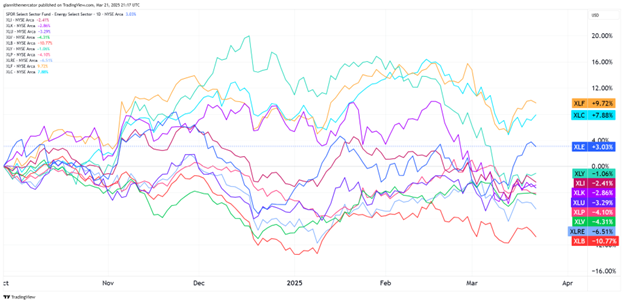
One of the reasons why the indices may struggle to sustain a bid in the near-term is because the internals from a sector standpoint are not showing the right type of leadership. The comeback in energy (XLE) is remarkable, and reminiscent of what transpired in the first quarter of 2022.
Seeing the tech sector (XLK) continue to slip in the performance rankings is the last thing that bulls need to see right now, and we're also in a situation where the performance spread between consumer staples (XLP) and consumer discretionary (XLY) is only around 2% now.
The bright spots in the tape, however, continue to be financials (XLF) and communications (XLC). While there is some weakness in the tape, I would be hard pressed to call it a full-blown recessionary signal just yet.
| 1 week | 3 Weeks | 13 Weeks | 26 Weeks |
| Energy | Energy | Energy | Communications |
Editor's Note: Energy starting to run the table – the money printer is going to be turned on again soon.
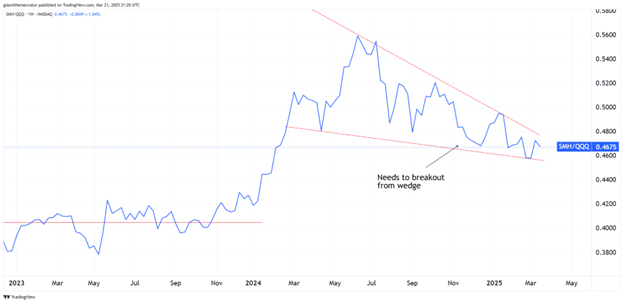
The U.S. Markets Need Chips (Sector ETF: SMH/QQQ)
One of the reasons why we dive into sectors and various asset classes on a weekly basis here is to help measure the market's appetite for risk. And coming out of a market bottom, there is a tendency for certain sectors to perform better than others.
One of those sectors is semiconductors (SMH). This sector is absolutely critical to help measure the health of the tech sector, as many of the new tech developments require an upgrade in chips and processing capacity.
This is why I like to use the ratio between semiconductors (SMH) and the Nasdaq 100 (QQQ) to help measure the health of the growth segment of the market. If we can get a breakout from the falling wedge pattern on this ratio chart here, and a break to the upside, it would send a strong signal that the market has bottomed or is very close to doing so.
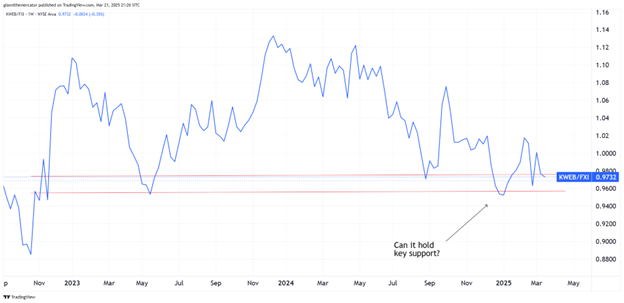
Which Tech to Focus On? (Sector ETF: KWEB/FXI)
While the majority of investors and traders in the U.S. remain fixated on the woes of the Magnificent Seven, those that are paying attention to the real capital flows are turning their attention to the Chinese market.
We've looked at this chart between Chinese internet stocks (KWEB) and large-cap Chinese stocks (FXI) recently, and it continues to hold up in a manner that is encouraging for the bullish case.
As long as this ratio holds above the technical support zone drawn on this chart. It seems that the DeepSeek moment from January has changed the game in the tech space, as global capital realizes that the Chinese market can offer similar technological returns for lower capital expenditures.
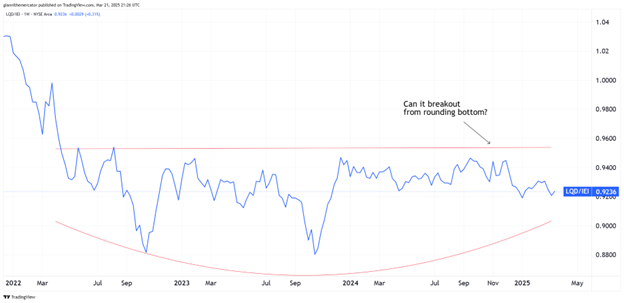
Fed to the Rescue? (Sector ETF: LQD/IEI)
At this point, I would argue the ratio between investment-grade corporate debt (LQD) and 7-10 Year Treasuries (IEI) may be the most important one for the entire bond market. This helps us measure liquidity levels via credit spreads.
With the end of Quantitative Tightening (QT) in sight, Fed Chair Powell remarked that we could still look forward to at least two more rate cuts this year. To be clear – I think there will be a third one in there too.
But I'm still most keen on a breakout in this ratio from the multi-year rounding bottom formation. If we breakout above resistance of this formation, the market is going to be flush with liquidity, which means we'll be able to ride the wave higher.
My Take:
The market sentiment is very negative right now. Many are looking for a recession, but I'm more focused on an economic slowdown. You have to understand that an accommodative Fed serves to offset the economic damage from federal spending cuts.
It feels funny to say that spending cuts in Washington could lead to economic damage, but it's true, only in the short-term. It really is a situation of short-term pain for long-term gain. The situation was unsustainable.
I've remarked before how the window of opportunity to shore up the budget situation won't last forever. We need spending cuts but also a massive refinancing wave of federal debt. A lot of it matures in the coming months, and if it can be done with lower rates, it could buy much more time – assuming we don't revert back to the old ways.
Cryptocurrency
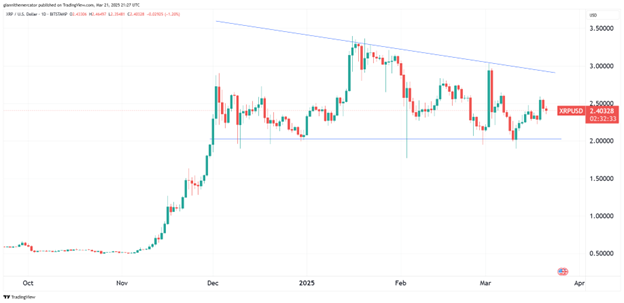
XRP has developed a compelling technical setup as it forms a descending triangle pattern with price coiling between a solid horizontal support at $2.00 and a declining resistance line from the January highs. This pattern, which has been developing since February, represents a compression of price that typically resolves in a powerful directional move.
The recent bounce off the $2.00 level shows encouraging signs of stabilization, with the latest price action creating a series of higher lows within the triangle. This subtle shift in momentum suggests the selling pressure may be waning as the pattern approaches its apex.
XRP’s tendency to make explosive moves after periods of compression adds further weight to this setup. However, prudent risk management remains essential – a sustained break below the critical $2.00 support would invalidate this bullish thesis and potentially signal a deeper correction toward prior support zones. For now, the technical structure suggests this triangle formation is likely storing energy for the next leg higher.
Legal Disclosures:
This communication is provided for information purposes only.
This communication has been prepared based upon information, including market prices, data and other information, from sources believed to be reliable, but Benzinga does not warrant its completeness or accuracy except with respect to any disclosures relative to Benzinga and/or its affiliates and an analyst’s involvement with any company (or security, other financial product or other asset class) that may be the subject of this communication. Any opinions and estimates constitute our judgment as of the date of this material and are subject to change without notice. Past performance is not indicative of future results. This communication is not intended as an offer or solicitation for the purchase or sale of any financial instrument. Benzinga does not provide individually tailored investment advice. Any opinions and recommendations herein do not take into account individual client circumstances, objectives, or needs and are not intended as recommendations of particular securities, financial instruments or strategies to particular clients. You must make your own independent decisions regarding any securities, financial instruments or strategies mentioned or related to the information herein. Periodic updates may be provided on companies, issuers or industries based on specific developments or announcements, market conditions or any other publicly available information. However, Benzinga may be restricted from updating information contained in this communication for regulatory or other reasons. Clients should contact analysts and execute transactions through a Benzinga subsidiary or affiliate in their home jurisdiction unless governing law permits otherwise.
This communication may not be redistributed or retransmitted, in whole or in part, or in any form or manner, without the express written consent of Benzinga. Any unauthorized use or disclosure is prohibited. Receipt and review of this information constitutes your agreement not to redistribute or retransmit the contents and information contained in this communication without first obtaining express permission from an authorized officer of Benzinga. Copyright 2022 Benzinga. All rights reserved.
© 2025 Benzinga.com. Benzinga does not provide investment advice. All rights reserved.
Trade confidently with insights and alerts from analyst ratings, free reports and breaking news that affects the stocks you care about.

