

Market Overview
It was Liberation Day alright – liberation from the bulls. Stocks were pummeled last week, and closed at their lowest level in nearly a year. The S&P 500 was down 9.08% on the week, while the Nasdaq was down 10.02%. The Dow Jones Industrial Average finished 7.86% lower on the week. Interest rates dropped notably but the selloff in the Dollar continued. Crude oil is flashing a major recession signal now, but cryptos held up mysteriously well on Friday – could this be the start of a new normal?
Stocks I Like
XPeng XPEV +28% Return Potential

What's Happening
- XPEV (XPeng Inc.) is a leading innovator in the electric vehicle sector, committed to advancing smart EV technology and providing a diverse portfolio of sustainable mobility solutions.
- The company's revenue has trended in the right direction over the years, although it continues to struggle with earnings. Its latest result showed revenue of $16.11 billion, while it lost $1.33 billion.
- This valuation on XPEV is a bit tricky since it isn't profitable yet. Its Price-to-Sales is at 3.48 and its Book Value is at 4.53, so it's expensive from those metrics.
- From a technical standpoint, XPEV looks to be breaking out from a falling wedge formation after completing a higher-low with respect to the trend.
Why It's Happening
- XPeng recently launched upgraded 2025 versions of its G6 and G9 models, featuring standard 5C AI batteries and Turing AI-powered smart driving capabilities. These technological advancements position XPeng at the forefront of EV innovation, offering consumers state-of-the-art features that could drive increased demand and justify premium pricing, ultimately boosting the company’s profit margins.
- The company’s XNGP advanced driving system achieved an 86% monthly active user penetration rate in urban settings. This high adoption rate of XPeng’s cutting-edge technology demonstrates strong customer engagement and satisfaction.
- The company has successfully expanded into new international markets, including Indonesia, Switzerland, the Czech Republic, Slovakia, and the UK. This global expansion strategy opens up new revenue streams and reduces XPeng’s reliance on any single market.
- XPeng’s collaboration with Volkswagen, established in July 2024, has enhanced its technological prowess and market leverage. This partnership with a major global automaker validates XPeng’s technology and could lead to shared resources, reduced costs, and potential licensing opportunities. Such strategic alliances position XPeng for long-term success and could significantly boost its competitive advantage.
- The company’s successful launch of the world’s first AI-defined vehicle, the XPENG P7+, in November 2024 demonstrates its commitment to innovation. This groundbreaking product positions XPeng as a technology leader in the EV industry, potentially attracting tech-savvy consumers and commanding premium pricing.
- XPeng’s Q1 2025 deliveries skyrocketed by 331% year-over-year, reaching 94,008 Smart EVs.
- Analyst Ratings:
- Barclays: Underweight
- JP Morgan: Overweight
- B of A Securities: Buy
My Action Plan (28% Return Potential)
- I am bullish on XPEV above $17.50-$18.00. My upside target is $25.00-$26.00.
Monster Beverages MNST +32% Return Potential

What's Happening
- MNST (Monster Beverage Corporation) is an innovator in the energy drink sector, with its portfolio of high-performance beverages that provide a diverse range of refreshing and bold energy solutions.
- This company has solid revenue and earnings. Its recent report showed revenue above $1.8 billion on the quarter along with earnings north of $270.7 million.
- Valuation in MNST is high. P/E is at 39.28, Price-to-Sales is at 7.91, and EV to EBITDA is at 27.75.
- From a charting standpoint, MNST broke out from a wedge formation. It looks keen on experiencing some acceleration to the upside in terms of momentum.
Why It's Happening
- Monster Energy products are now distributed in 159 countries and territories worldwide, with strategic brands reaching 57 markets and affordable energy drinks like Predator & Fury distributed in 34 countries. This extensive network not only solidifies its global presence but also opens doors for growth in untapped regions, which could significantly boost sales and stock performance.
- The global energy drink market is projected to grow at a compound annual growth rate (CAGR) of 7.6% from 2025 to 2029. Monster Beverage is well-positioned to capitalize on this trend with its diverse portfolio of energy drinks, including Monster Energy®, Reign®, and Bang®. As the market expands, Monster could capture a larger share, driving revenue growth and increasing shareholder value.
- Co-CEOs Rodney Sacks and Hilton Schlosberg have consistently delivered strong results through strategic initiatives and sound decision-making. Their leadership has been instrumental in navigating challenges and driving growth across multiple product categories and global markets, which bodes well for future performance.
- Monster Energy's sponsorship of events like the Baja Beach Bash has raised over $2 million for charitable causes. These efforts enhance brand reputation and foster consumer loyalty, which are crucial for sustaining long-term sales growth in competitive markets.
- Gross profit as a percentage of net sales improved to 55.5% on a non-GAAP basis in Q4 2024, up from previous quarters. This margin expansion demonstrates effective cost management and pricing strategies, which are critical for sustaining profitability in the competitive beverage industry. Investors can expect higher earnings per share as margins improve further.
- Monster Beverage reported record fourth-quarter 2024 net sales of $1.81 billion, marking a 4.7% increase year-over-year.
- Analyst Ratings:
- Citigroup: Buy
- Morgan Stanley: Overweight
- Needham: Hold
My Action Plan (32% Return Potential)
- I am bullish on MNST above $50.00-$51.00. My upside target is $75.00-$76.00.
Market-Moving Catalysts for the Week Ahead
Liberation From the Bulls?
The Trump Administration finally announced the tariff rates for various parts of the world. The predominant theme I noticed was that tariffs were notably higher for the Asian market than various parts of South and Central America.
The intent appears to be obvious – a shift in preferred status when it comes to trade partners. Canada and Mexico don't seem to be getting the worst part of the deal just yet, but now we get to sit back and see how "Global Capital" reacts.
This appears to be setting the stage for a new global economic order. The last time we had a rearrangement of this magnitude was arguably in 1971 when Nixon dropped the U.S. from the gold standard. But this rearrangement is more focused on trade policy, for now. At some point, it will reflect in the monetary policy too.
The Interest Rate Agenda
The key thing to understand about this market environment is that it's all about interest rates. A couple years back, we talked about the Fed engineering a recession or an economic slowdown in order to get inflation back to suitable levels. Now it seems to be the government that's doing it.
This is virtually unprecedented in modern economic history. In many ways, it's an attempt to reallocate resources from Wall Street to Main Street. The majority of Americans have the majority of their wealth tied up in their primary residences compared to their investment portfolio.
Causing an economic slowdown is going to help real estate transactions pick up again. This will increase the probability of home prices rising. But the key is that unemployment can't rise meaningfully. And of course, there is the trillion-dollar debt bomb in Washington that needs to be refinanced too. It's just a window in time, and it too, will close eventually.
Sector & Industry Strength
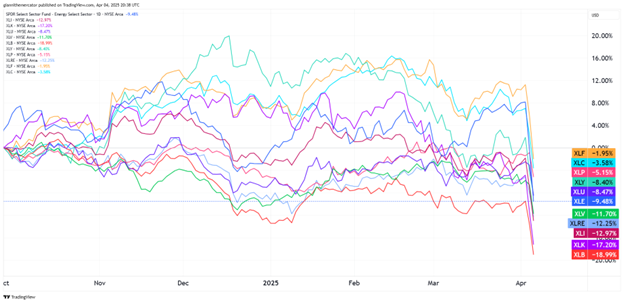
The market's internals are as nasty as the surface. Technology (XLK) is now the second worst-performing sector in the market going back to the start of Q4. This is the last thing bulls wanted to see, but are any even left right now?
But the bigger story is that virtually every sector in the S&P is now lower going back to the start of Q4. Note how the defensive sectors like consumer staples (XLP) and utilities (XLU) have risen towards the top of the rankings. This is normal bear market behavior.
We've also seen consumer discretionary (XLY) drop below consumer staples (XLP) in the performance rankings, which signals the market thinks there will be some distress on the consumer. Not a good tape.
| 1 week | 3 Weeks | 13 Weeks | 26 Weeks |
| Consumer Staples | Consumer Staples | Consumer Staples | Financials |
Editor's Note: Staples run the tape. Lay low.
Queue Up the Q's (Sector ETF: CQQQ/QQQ)
Chinese stocks versus U.S. stocks – it's a theme that we've been talking about for months now, and it's not one that seems to be going away anytime soon. There's a big battle going on when it comes to innovation, and its playing out in each of these countries' tech sectors.
This is why I wanted to compare the respective "Qs" from each country. We're looking here at the ratio between Chinese tech (CQQQ) and the Nasdaq 100 (QQQ). Over the years, QQQ has done better, but since January 2024, CQQQ has the edge. In other words, this theme has been playing out for over a year already.
In fact, the ratio is on the precipice of breaking out from a rounding bottom pattern. If this takes, I expect it to kick off a frenzy in Chinese tech names especially, which seem to be consolidating their momentum after the DeepSeek launch back in January.

Measuring Inflation Momentum (Sector ETF: DBC/SPY)
After the most recent uptick in inflation pressure per economic data, I think it's a good time to check back in on the ratio between commodities (DBC) and the S&P 500 (SPY). This ratio is key to understanding the state of inflationary pressures.
I'll lay it out simply for you – when inflationary pressures are accelerating, it's better to own commodities (DBC) than stocks (SPY). But when inflationary pressures are slowing down or absent entirely, it's better to own stocks.
Therefore, it's no surprise to see how this ratio dropped from the June 2022 high so sharply – that was the peak of inflationary pressures. But it's started to tick higher since December, which is something that needs to be watched closely, especially if it breaks above the upper trendline of the channel.

Is This the Fed's Favorite Indicator? (Sector ETF: LQD/IEI)
It's all about those credit spreads. Every now and then, the Fed will drop a truth bomb and talk about how they monitor credit conditions carefully. Even though maintaining market liquidity isn't part of their dual mandate, it's something they take very seriously.
The easiest way to measure credit spreads is to look at the ratio between investment-grade corporate debt (LQD) and 3-7 Year Treasuries. Remember, when we look at spreads between bonds, we want the duration (time until it matures) to be similar. LQD's duration is in the same ballpark as IEI.
When LQD outperforms IEI and the ratio rises, it means that liquidity conditions are improving. While that's been the case overall since October 2022, we've actually seen a steady decline in the ratio, or a widening in spreads, since summer 2024. It's a big reason why there's been volatility.

My Take:
The rounding bottom pattern is absolutely key to the health of the overall market. That is, I fully expect a breakout to follow from this pattern if we're really going to see another round of easing from the Fed, and ultimately, for stocks to rebound higher.
When there are no buyers, or the market has no bid, that's how you get crashes. When credit spreads blow out, or IEI outperforms LQD by a wide margin, you get an early signal that a crash is a potential outcome.
Cryptocurrency
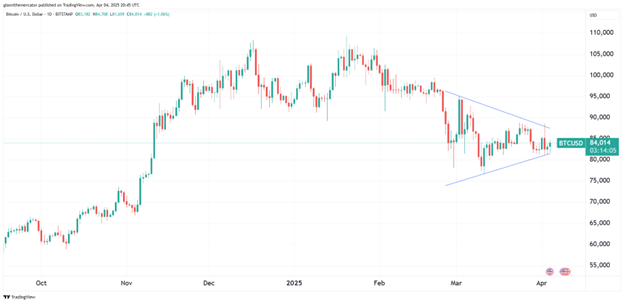
Bitcoin is presenting an intriguing technical setup as it forms a symmetrical triangle pattern in the aftermath of its correction from the $108,000 peak. This consolidation formation, defined by converging trendlines with support rising from $76,000 and resistance declining from $96,000, suggests we’re approaching a critical breakout point.
What makes this setup particularly compelling is how the lower boundary of the triangle aligns with the structural support zone around $76,000-78,000, which has proven its significance multiple times since February.
A decisive break above the triangle’s upper boundary would confirm this bullish thesis and potentially signal the beginning of Bitcoin’s next leg higher. However, traders should remain vigilant – a break below the lower trendline would invalidate this setup and suggest further consolidation may be needed before a sustainable uptrend can resume.
Legal Disclosures:
This communication is provided for information purposes only.
This communication has been prepared based upon information, including market prices, data and other information, from sources believed to be reliable, but Benzinga does not warrant its completeness or accuracy except with respect to any disclosures relative to Benzinga and/or its affiliates and an analyst’s involvement with any company (or security, other financial product or other asset class) that may be the subject of this communication. Any opinions and estimates constitute our judgment as of the date of this material and are subject to change without notice. Past performance is not indicative of future results. This communication is not intended as an offer or solicitation for the purchase or sale of any financial instrument. Benzinga does not provide individually tailored investment advice. Any opinions and recommendations herein do not take into account individual client circumstances, objectives, or needs and are not intended as recommendations of particular securities, financial instruments or strategies to particular clients. You must make your own independent decisions regarding any securities, financial instruments or strategies mentioned or related to the information herein. Periodic updates may be provided on companies, issuers or industries based on specific developments or announcements, market conditions or any other publicly available information. However, Benzinga may be restricted from updating information contained in this communication for regulatory or other reasons. Clients should contact analysts and execute transactions through a Benzinga subsidiary or affiliate in their home jurisdiction unless governing law permits otherwise. This communication may not be redistributed or retransmitted, in whole or in part, or in any form or manner, without the express written consent of Benzinga. Any unauthorized use or disclosure is prohibited. Receipt and review of this information constitutes your agreement not to redistribute or retransmit the contents and information contained in this communication without first obtaining express permission from an authorized officer of Benzinga. Copyright 2022 Benzinga. All rights reserved.
© 2025 Benzinga.com. Benzinga does not provide investment advice. All rights reserved.
Trade confidently with insights and alerts from analyst ratings, free reports and breaking news that affects the stocks you care about.

