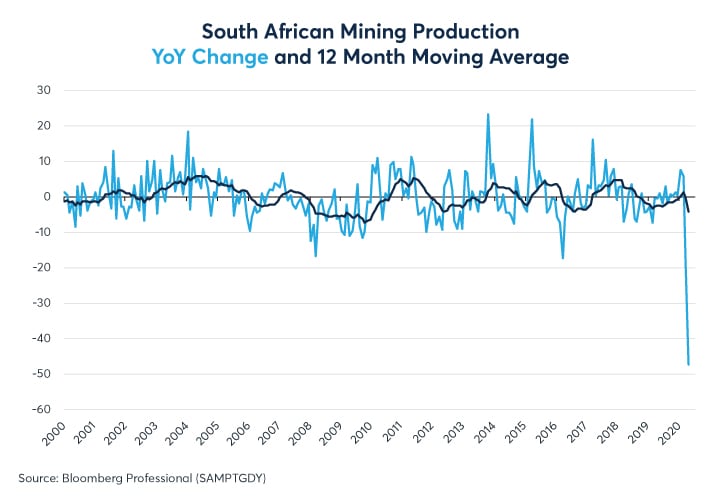
As with most of the world, South Africa’s economy has been hard hit by the coronavirus pandemic. Activity in certain sectors such as mining and manufacturing fell more than 40% year-over-year in May as the country entered a strict lockdown phase (Figure 1 and 2).
Figure 1: South African mining production fell by nearly 50% year-on-year in April
Figure 2: Manufacturing production fell by nearly 50% year on year during lockdown
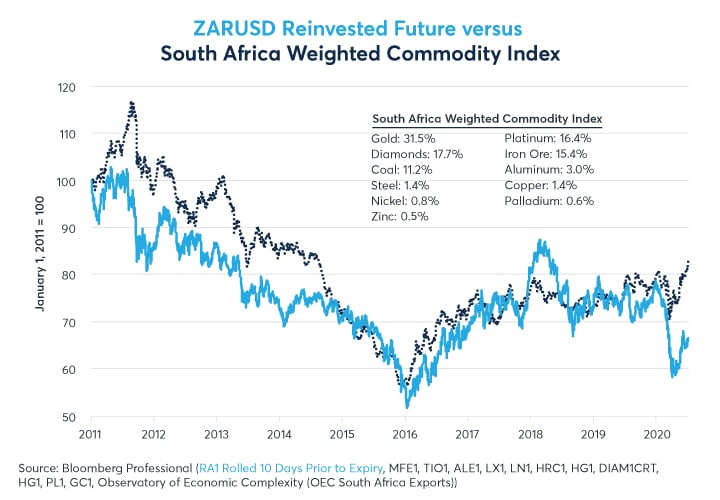
The South African rand (ZAR), which normally closely tracks a trade-weighted index of the country’s exchange-traded commodity exports, fell sharply in March and has only recovered marginally since. Meanwhile, our South Africa weighted commodity index, which is heavily weighted towards precious metals and diamonds, has hit its highest levels since 2014 (Figure 3). Ordinarily, ZAR might have benefitted from higher precious metals prices, but with gold mining down 59.6% and platinum production off 62% in April and May from the same period a year earlier, export revenues that might have supported the currency were lacking.
Figure 3: ZAR normally tracks commodity prices but mining shutdowns have caused divergence
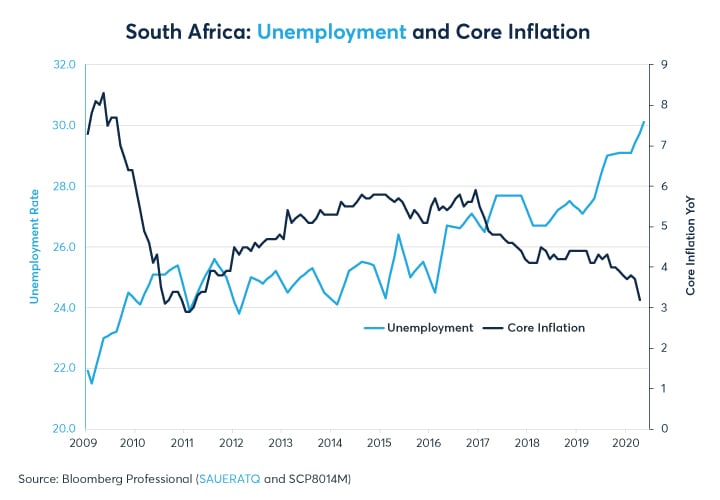
Even before the pandemic began, South Africa was economically challenged. A decade of mostly falling commodity prices contributed to a rise in unemployment from around 20% in 2008 to over 30% in March 2020 (the latest available data). South Africa releases Q2 unemployment data on August 11.
Higher unemployment has coincided with generally declining inflation (Figure 4). Core inflation, which was running as high as 8% before the global financial crisis, recently fell to around 3% --and that was before the pandemic struck and energy prices fell substantially. As such, it is possible that we could see a further decline in core inflation, especially headline inflation, in the coming months.
Figure 4: Pre-pandemic, South Africa’s unemployment was over 30% and inflation was falling
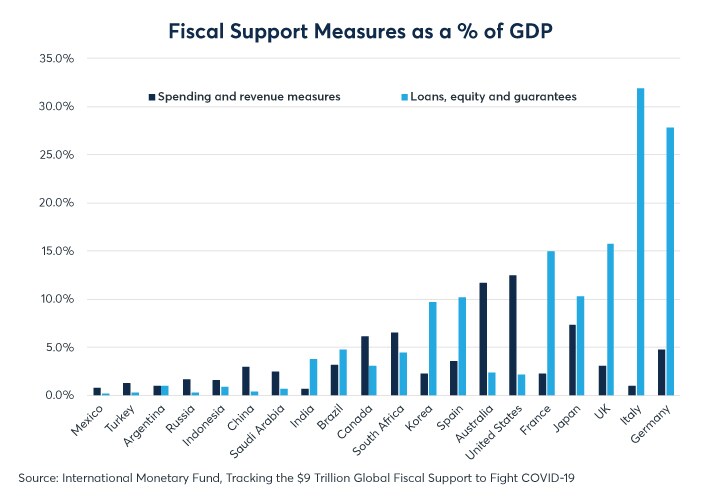
The combination of a sharp decline in economic activity and the expectation that already low inflation could fall further have led South Africa’s central bank to cut interest rates to their lowest level ever (Figure 5). The cuts have steepened South Africa’s yield curve to its most positively sloped level in history. Currently, the difference between South Africa’s 10-year and one-year swap rates is close to 4% (Figure 6). The correlation between yield curve slopes and subsequent economic activity tends to be positive 3-7 quarters in advance (Figure 7). In addition to rate cuts, South Africa’s government has also enacted fiscal support measures that are far more generous than those in most other emerging markets. Direct fiscal support, including payments to furloughed workers, comes to nearly 7% of GDP. Loans to businesses and other entities add new credit worth another 4% of GDP (Figure 8). As such, fixed income traders appear to be positioned for South Africa’s rate cuts and fiscal stimulus measures to produce a strong economic rebound in 2021.
Figure 5: South Africa’s central bank has cut interest rates to their lowest level ever
Figure 7: In the past, the yield curve has correlated positively with subsequent rates of growth
Figure 6: Rate cuts have steepened the yield curve to its steepest level ever
Figure 8: South Africa has enacted more generous fiscal support than any other emerging market
South Africa has average levels of indebtedness compared to emerging market peers and much lower levels of debt than the US, Eurozone, UK and Japan. At around 140% of GDP, total debt in the non-financial sector is less than in China, Chile and Brazil but higher than the least indebted countries such as Colombia, India, Mexico and Russia (Figures 9 and 10).
Figure 9: South Africa has lower debt than most countries
Figure 10: South Africa’s debt levels grew slightly faster than GDP during the 2010s.
Generally, less indebted countries tend to show stronger reactions to fiscal and monetary stimulus. As such, South Africa’s relatively low levels of debt may explain why South Africa’s yield curve has steepened to such a great extent in the face of fiscal stimulus and monetary easing.
In the short term, one indicator of South Africa’s economic activity to watch is electricity consumption. It fell 23.3% year-on-year in April but was down a relatively low 13.6% in May (Figure 11). The June number, to be released on August 6, might provide some insight as to the state of economic activity late in the second quarter.
Figure 11: Electricity consumption might give early insight into the state of manufacturing and mining
In the intermediate-term, the major question hanging over South Africa’s economy is whether there will be a second pandemic-related lockdown later this year. If so, it could recreate the conditions for another decoupling of ZAR from commodity prices. If not, and if mines remain open, South Africa could potentially see some benefits from higher gold and other commodity prices.
As South Africa’s central bank has cut interest rates, the “carry” (the interest rate differential between two nations’ currency deposits) has begun to narrow versus USD. Currently, South African rates are about 3.75% over US rates (Figure 12).
Figure 12: South Africa has been able to cut rates more than the Fed, whose rates are near zero
Interest rates differentials can accumulate into large differences in performance over long periods of time. For example, if on January 1, 2000, one had taken $100 worth of South African rand and put them under a mattress, those ZAR would be worth approximately $36 at the July 9, 2020 spot exchange rate. By contrast, had one invested $100 worth of rand in a South African bank account on January 1, 2000, they would be worth 26% more than the $100 invested in a comparable US dollar bank account (Figure 13).
Figure 13: Since 2000, ZAR has lost 64% of its spot value but interest ‘carry’ makes up the difference
Bottom Line
- ZAR has decoupled from commodity prices amid mining shutdowns
- South African’s central bank has cut rates to a record low
- Record low rates and robust fiscal stimulus have generated a positively sloped yield curve
- South Africa has less debt than most other countries
- Low levels of debt may make South Africa more responsive to fiscal and monetary stimulus
- Watch electricity consumption as an indicator of mining and manufacturing activity
- Accumulated interest rate ‘carry’ makes a big difference over time to currency investors
- Lower interest rates are narrowing the amount of carry available
To learn more about futures and options, go to Benzinga’s futures and options education resource.
© 2024 Benzinga.com. Benzinga does not provide investment advice. All rights reserved.
Comments
Trade confidently with insights and alerts from analyst ratings, free reports and breaking news that affects the stocks you care about.


