This post contains sponsored advertising content. This content is for informational purposes only and not intended to be investing advice.
U.S. equity futures are extending Monday’s gains this morning, rising higher for the last four days in a row. To help maintain gains, the market will be focused on several economic announcements today. Home price data figures are anticipated to increase slightly, while a consensus on consumer confidence is expected to dip moderately. The JOLTS Job Openings report will help to measure job vacancies ahead of Friday’s monthly jobs report.
Potential Market Movers
S&P 500 futures (/ES) are up .90% in pre-market trading, with the Dow Jones Industrial Average futures (/YM) and Nasdaq 100 futures (/NQ) also gaining, .85% and 1.10% respectively. This follows a positive day for the European markets and a mostly higher overnight session throughout Asia. From its mid-March lows, the Nasdaq 100 Index (NDX) is up nearly 15%, with the S&P 500 Index (SPX) up just under 10%. The strength in the market has sent the CBOE Market Volatility Index (VIX) down below its previous February lows, nearing the 19 level—a level still above historical averages but significantly below monthly highs near 37. Lower levels in the VIX can help to indicate less expected volatility in the market.
Concerns over the Russia-Ukraine war are still being monitored by investors, with peace talks expected to start shortly in Turkey. Investors will get an indication of inflation data later this week with the PCE prices being reported. The PCE price index is used to capture inflation (or deflation) across a wide range of consumer expenses, reflecting changes in consumer behavior.
Energy prices continue to be of key interest to consumers. Crude Oil futures (/CL) are dipping sharply this morning, trading lower by 5.75%. The commodity lost over 8% in Monday’s session and has fallen over 14% from last week’s highs. The price of oil continues to be heavily influenced by developments in the Russia-Ukraine situation.
The yield on the 10-Year Treasury Note (TNX) traded up to the 2.5% level on Friday but backed off this notable level in yesterday’s session, closing at 2.47%. When treasury yields reach 2.5% or higher, the risk-free trade for treasuries can attract more investors and put downside pressure on equity prices. Investors have also kept their eyes on Treasuries to monitor the falling yield curve. On Monday, the 5-year Treasury note rose above the 30-year, showing the first inversion since 2006. Yields on the 10-year and 2-year U.S. Treasuries did not invert but dipped to the .11 level. When yields on short-term debt instruments outpace longer-dated instruments the yield curve inverts by moving below zero. This reflects bond investors expectations for a decline in longer-term interest rates and is generally associated with recessions.
Three Things to Watch
Rising Rates and Real Estate: The Fed’s recent hike in interest rates, along with an expectation of more on the way, drove the 30-year mortgage rate to 4.95% today—the largest two-week gain since 2009. While an increase in interest rates can make it more difficult for new homebuyers to afford a house, collectively, real estate values have historically risen with interest rates. During periods of economic growth and high inflation, real estate and Real Estate Investment Trusts (REITs) tend to perform well. Strong economic growth can help fuel REIT expansion across several industries. Additionally, real estate investments can act as a hedge against unanticipated inflation because properties can increase rents with inflation and the value of buildings may also increase with inflation. The larger shift of employees now moving back into the office could also add demand to certain areas of commercial real estate.

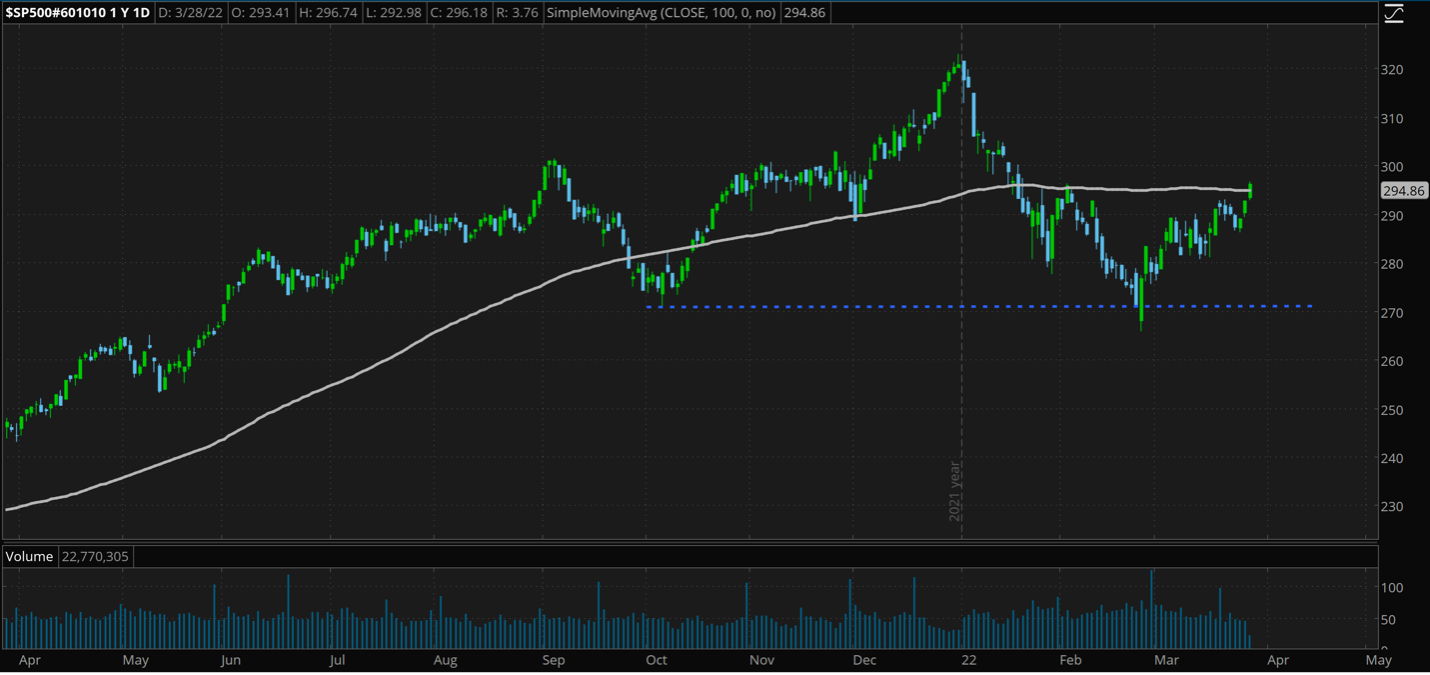
CHART OF THE DAY: REITS MOVE HIGHER. The S&P 500 Equity Real Estate Investment Trusts Industry REIT ($SP500#601010) closed above its 100-day moving average and above a previous level of price resistance. Typically, REITs will climb in a rising interest rate environment. Chart source: The thinkorswim® platform. For illustrative purposes only. Past performance does not guarantee future results.
Growth to Value Shifts: During periods when the 10-year Treasury yield is rising above the 2.5% level, value-type stocks have historically outperformed more expensive stocks. When risk-free yields climb, investors often make return comparisons. Value stocks tend to have lower P/E ratios than growth stocks and will provide a higher earnings yield compared to growth stocks. The earnings yield is calculated by dividing earnings by price, or E/P, and provides a company’s annual rate of earnings return at the current stock price. Additionally, high inflation has also been seen as a positive for value strategies. This is partly due to inflation fears that drive up the 10-year Treasury. In turn, this lowers the net present value (NPV) on more expensive stocks, making them more costly when compared with a higher risk-free return.

A Gold Bounce? Historical studies have shown that gold carries a low price correlation when compared to equities. In fact, several studies have shown that gold’s low correlation to equities is second only to bonds. With an average annual return of 10.61% since 1970, gold has seen its price trend recently move higher. Economic and world events, when combined with more-restrictive monetary policies, could lead to slower business growth. In turn, this may help gold prices resume an upward price trend.
Notable Calendar Items
March 29: JOLTS Job Openings
March 30: ADP Nonfarm Employment Report
March 31: Core PCE Price Index
April 1: Unemployment Rate, ISM Manufacturing
TD Ameritrade® commentary for educational purposes only. Member SIPC.
Image sourced from Unsplash
This post contains sponsored advertising content. This content is for informational purposes only and not intended to be investing advice.
© 2025 Benzinga.com. Benzinga does not provide investment advice. All rights reserved.
Trade confidently with insights and alerts from analyst ratings, free reports and breaking news that affects the stocks you care about.