We are pleased to present the January 2023 monthly report for the Global X Adaptive U.S Risk Management ETF (ONOF). ONOF seeks to provide a risk management solution by employing four technical indicators to dictate whether the Fund is participating in the U.S. equity markets or in a defensive stance in short term treasuries by tracking the Adaptive Wealth Strategies U.S. Risk Management Index (the “Index”). The two short-term indicators are Moving Average Convergence Divergence (MACD) and Volatility. The two longer-term indicators are the 200-day Moving Average and Drawdown.
Longer Term Indicators
The 200-day moving average is designed to detect longer-term trends in the market and used in an effort to provide stability, as this trend doesn’t change significantly from day to day. It is calculated by adding up the closing prices for each of the last 200 days and then divided by 200.
Drawdown has its roots in the behavioral side of investing. We measure the absolute drawdown from the prior high point in the market as an indicator. This indicator potentially indicates the market is headed toward a longer-term trend downward.
Shorter Term Indicators
MACD is designed to capture short-turning points in the market both up and down. The MACD can be one of the first technical indicators to signal a risk-off environment. MACD is a momentum indicator, reflecting the spread between the 12-day exponential moving average (EMA) and the 26-day EMA. A positive spread between the two EMAs indicates upward momentum, while a negative spread indicates downward momentum.
Volatility is also short-term in nature and can signal heightened uncertainty in the markets which tends to favor a risk off approach. Volatility is measured by the CBOE® Volatility Index.
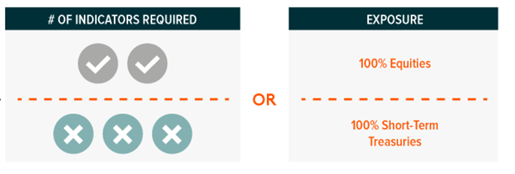
The Index requires at least two of the four indicators to have Entry signals in order to enter the “market” and be invested in equities. The Index requires at least three of the four indicators to have Exit signals to exit the market and be 100% exposed to short-term treasuries.
January 2023 Recap
ONOF started the new year in the Risk-Off position the Index has remained in since December 12, 2022. On January 9, 2023, an Entry Vote for MACD was triggered. Thus, two Entry Votes (MACD and Volatility) resulted in the Index changing to an “On” position. After 3 calculation days, the Index re-allocated back into U.S Equities. Even though the position change occurred on the 9th day of January, the Index already fulfilled the “10-day rule” requirement, which is that the Index must remain in a new position for at least 10 days in order to reduce turnover, in December 2022. The Index remained in an “On” position invested in U.S Equities for the remainder of January 2023.
In the 3-month period ending on January 31, 2023, ONOF returned 7.75% compared to the S&P 500 Index’s return of 5.76 % over the same period. ONOF’s 1-year return ending on January 31, 2023 was -1.05%, compared to the S&P 500 Index’s return of -8.22% over the same period.
The performance data quoted represents past performance based on NAV returns. Past performance does not guarantee future results. The investment return and principal value of an investment will fluctuate so that an investor’s shares, when sold or redeemed, may be worth more or less than their original cost and current performance may be lower or higher than the performance quoted. Standard performance and performance current to the most recent month-end is available by clicking here. Total Expense Ratio: 0.39%
Image sourced from Shutterstock
© 2025 Benzinga.com. Benzinga does not provide investment advice. All rights reserved.
Trade confidently with insights and alerts from analyst ratings, free reports and breaking news that affects the stocks you care about.

