Many successful traders use simple trading models to make profits. These models consist of a set of conditions or parameters. When they're met, the model sends a signal.
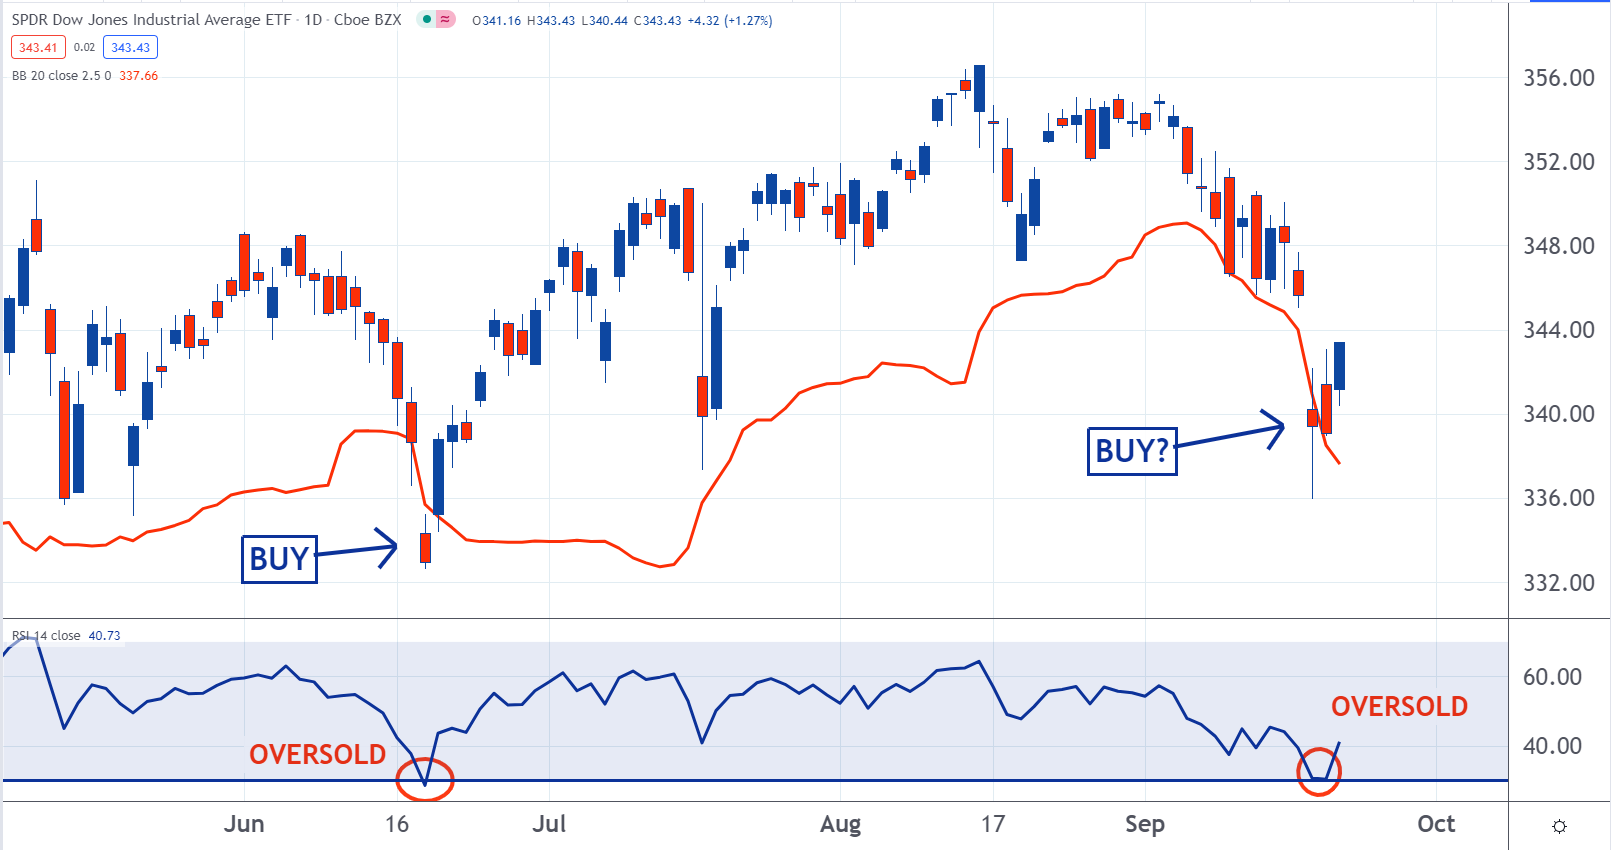
The following simple model suggests it may be time to buy the SPDR Dow Jones Industrial Average ETF Trust DIA.
The redline on the top part of the chart is 2.5 standard deviations below the 20-day moving average price. When DIA trades below this, it's considered to be oversold.
The lower part of the chart is the RSI momentum indicator. When the indicator reaches the lower blue horizontal line, it shows oversold conditions.
These are two different ways of measuring momentum. When they simultaneously show oversold conditions, it’s a buy signal. It was accurate in June and it may be so again now.
To learn more about trading models, join the new Benzina Trading School.

Edge Rankings
Price Trend
© 2025 Benzinga.com. Benzinga does not provide investment advice. All rights reserved.
Trade confidently with insights and alerts from analyst ratings, free reports and breaking news that affects the stocks you care about.