Zinger Key Points
- The Dow Jones 30 Index slipped on Tuesday, losing again the support of its 200-day moving average
- Sellers seem to be gaining momentum and now aim for March's lows.
- Feel unsure about the market’s next move? Copy trade alerts from Matt Maley—a Wall Street veteran who consistently finds profits in volatile markets. Claim your 7-day free trial now.
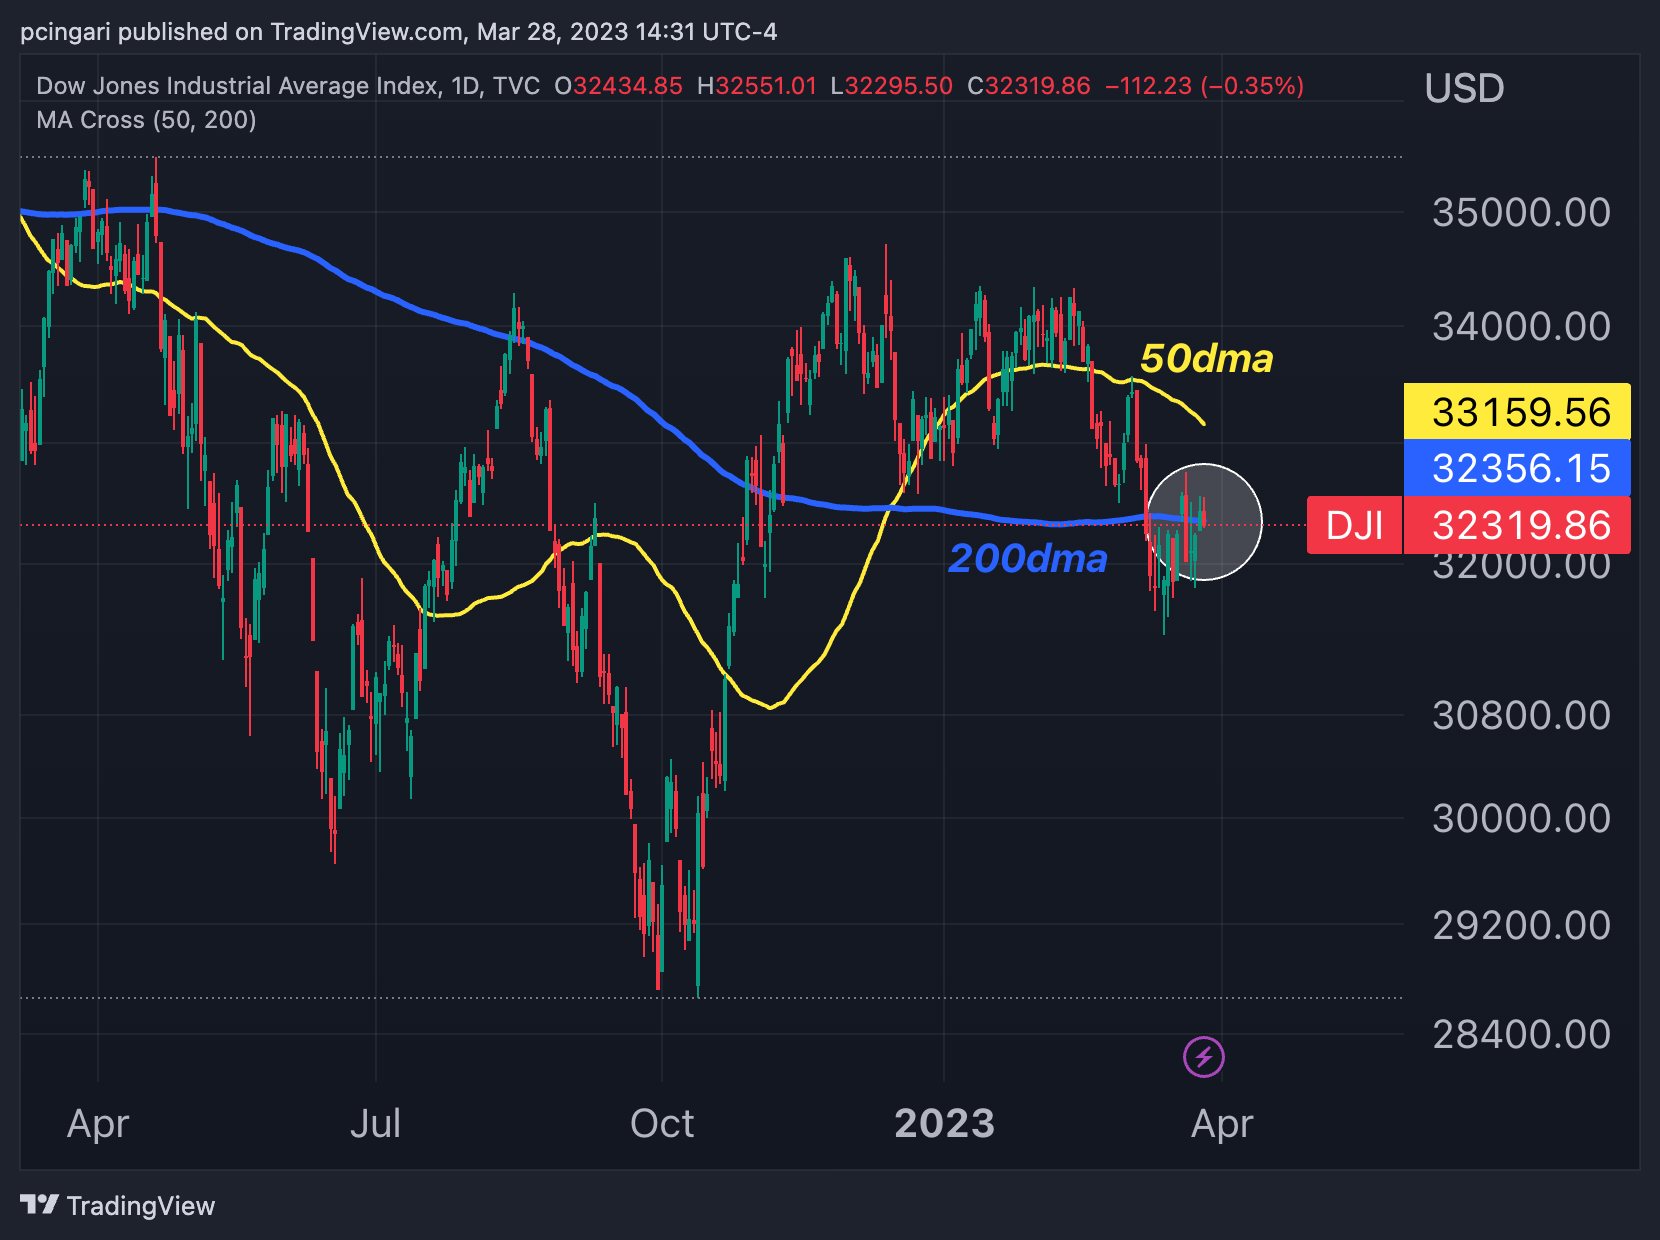
The Dow Jones Industrial Average slipped in the March 28 session as selling pressure intensified, pushing the index narrowly below the support of the 200-day moving average located at 32,356 points.
Over the past two weeks, the Dow has battled fiercely up and down with the 200-dma, which represents a significant technical milestone where traders are concentrating their attention to gauge the index's future moves.

Dow Jones Industrial Average (DJI) 1-day – Chart: TradingView
What’s Moving The Dow?
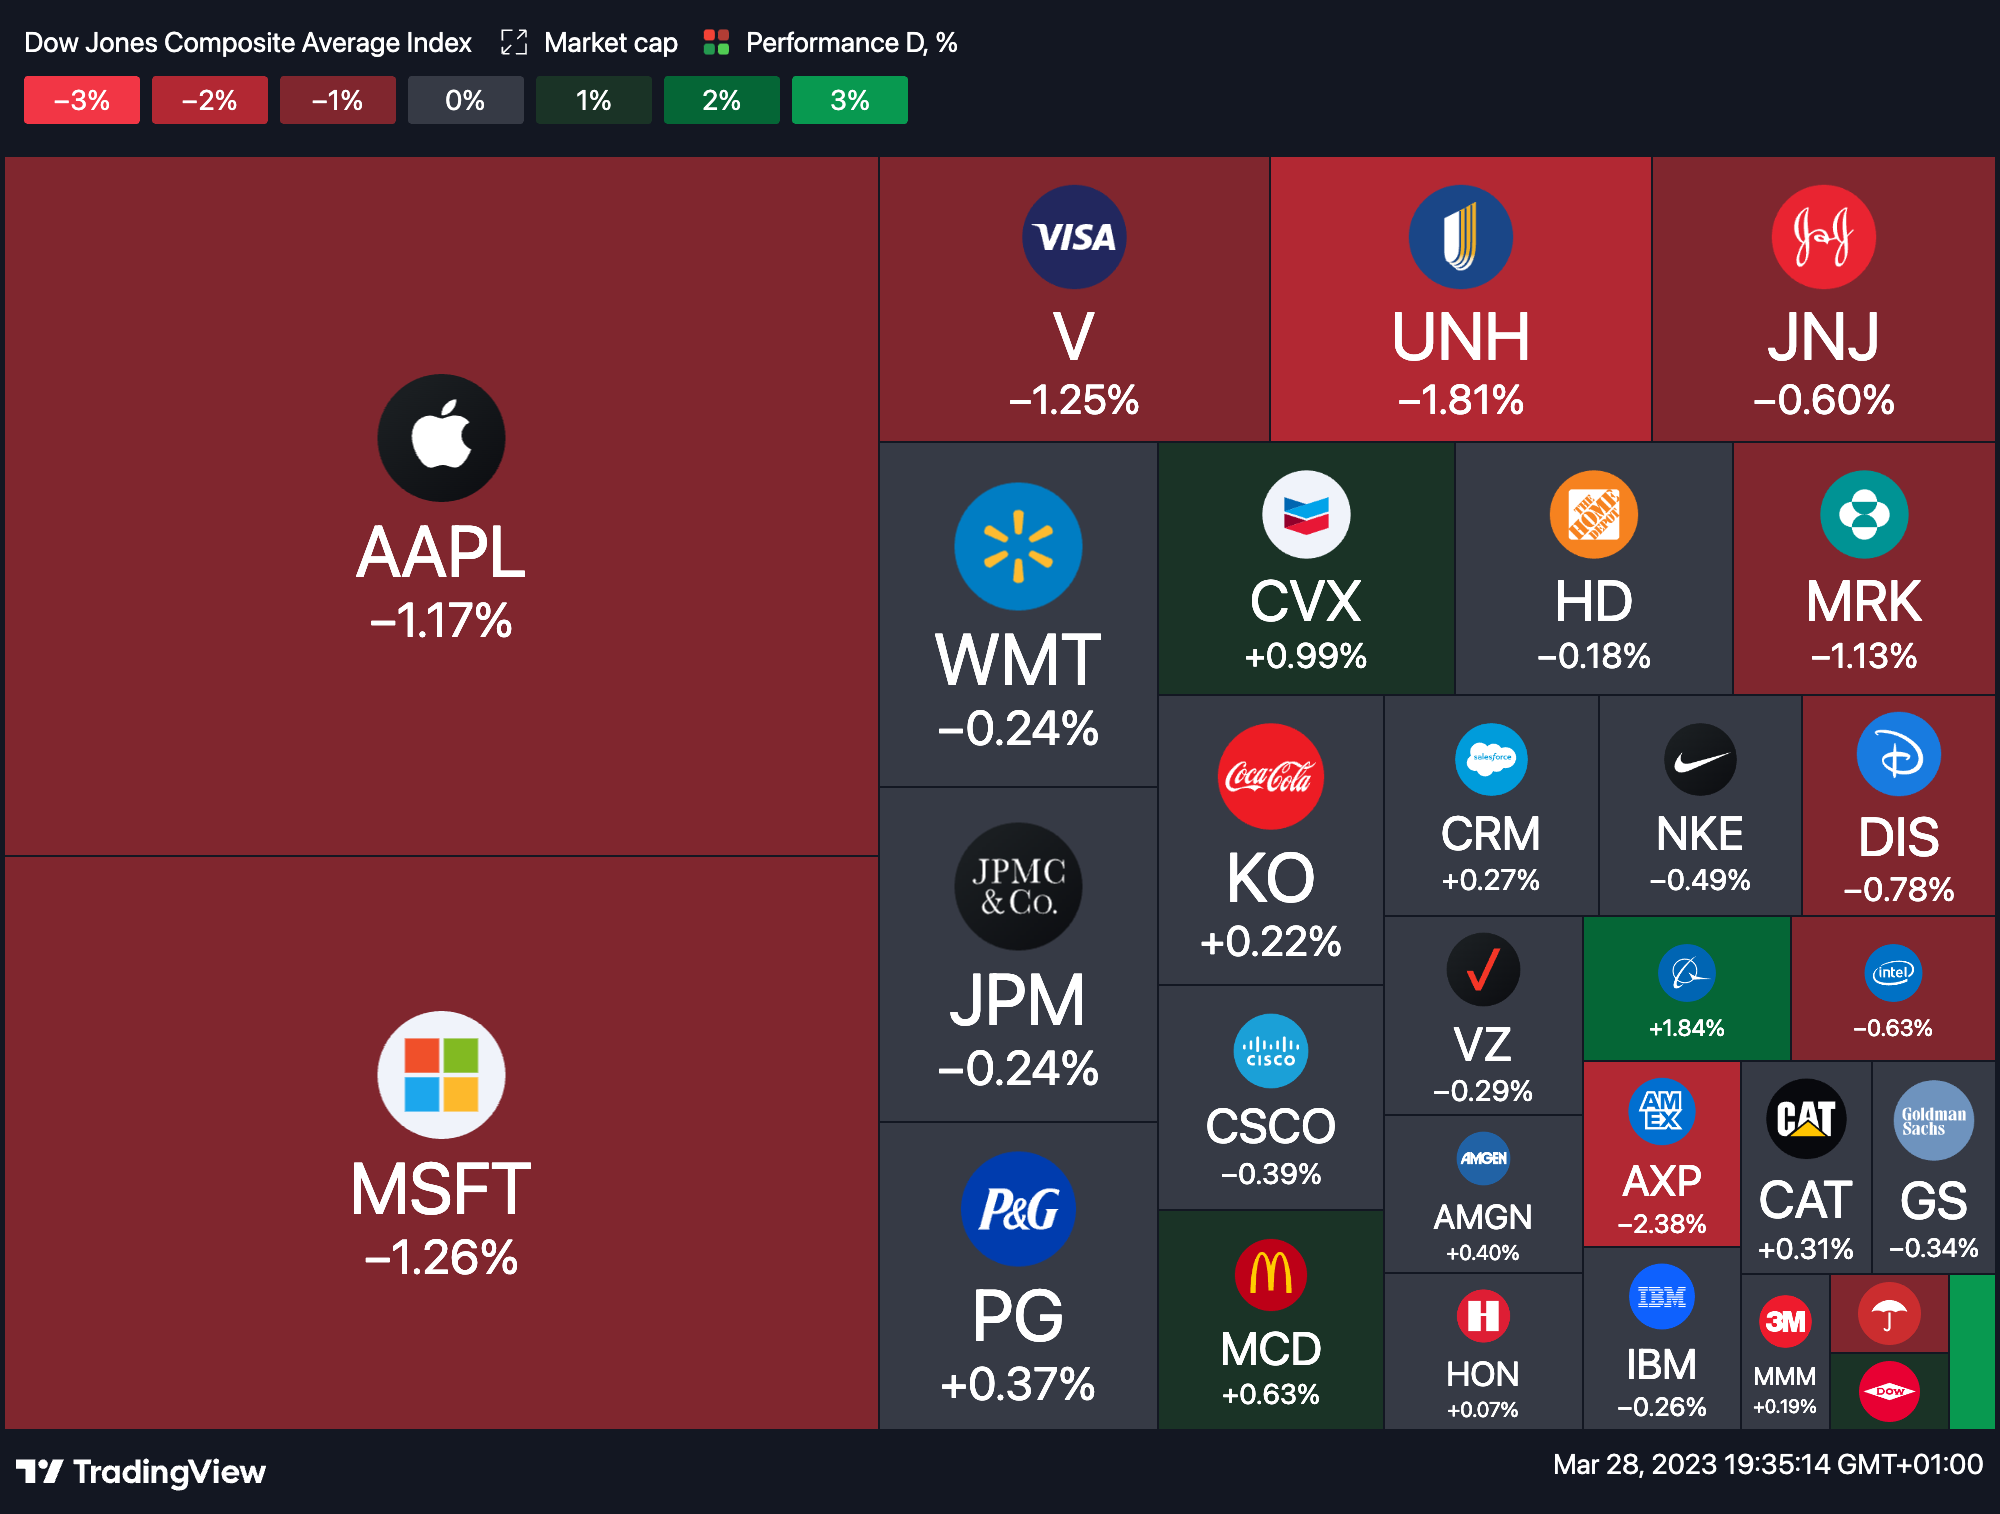
The Dow's negative daily performance was mostly dragged down by its heavyweights such as UnitedHealth Group Incorporated UNH, which fell 1.6%, Microsoft Corp MSFT, which fell 1.4%, and American Express Corporation AXP, which fell 2.5%.
In contrast, Boeing Company BA and Chevron Corporation CVX offered some positive contribution to the Dow's overall performance.

DJIA movers on March 28 – Chart: TradingView
Technical Analysis: What’s Next For DIA?
The SPDR Dow Jones Industrial Average ETF Trust DIA is the most popular exchange traded fund tracking the performance of the Dow Jones Industrial Average, by using a full replication technique.
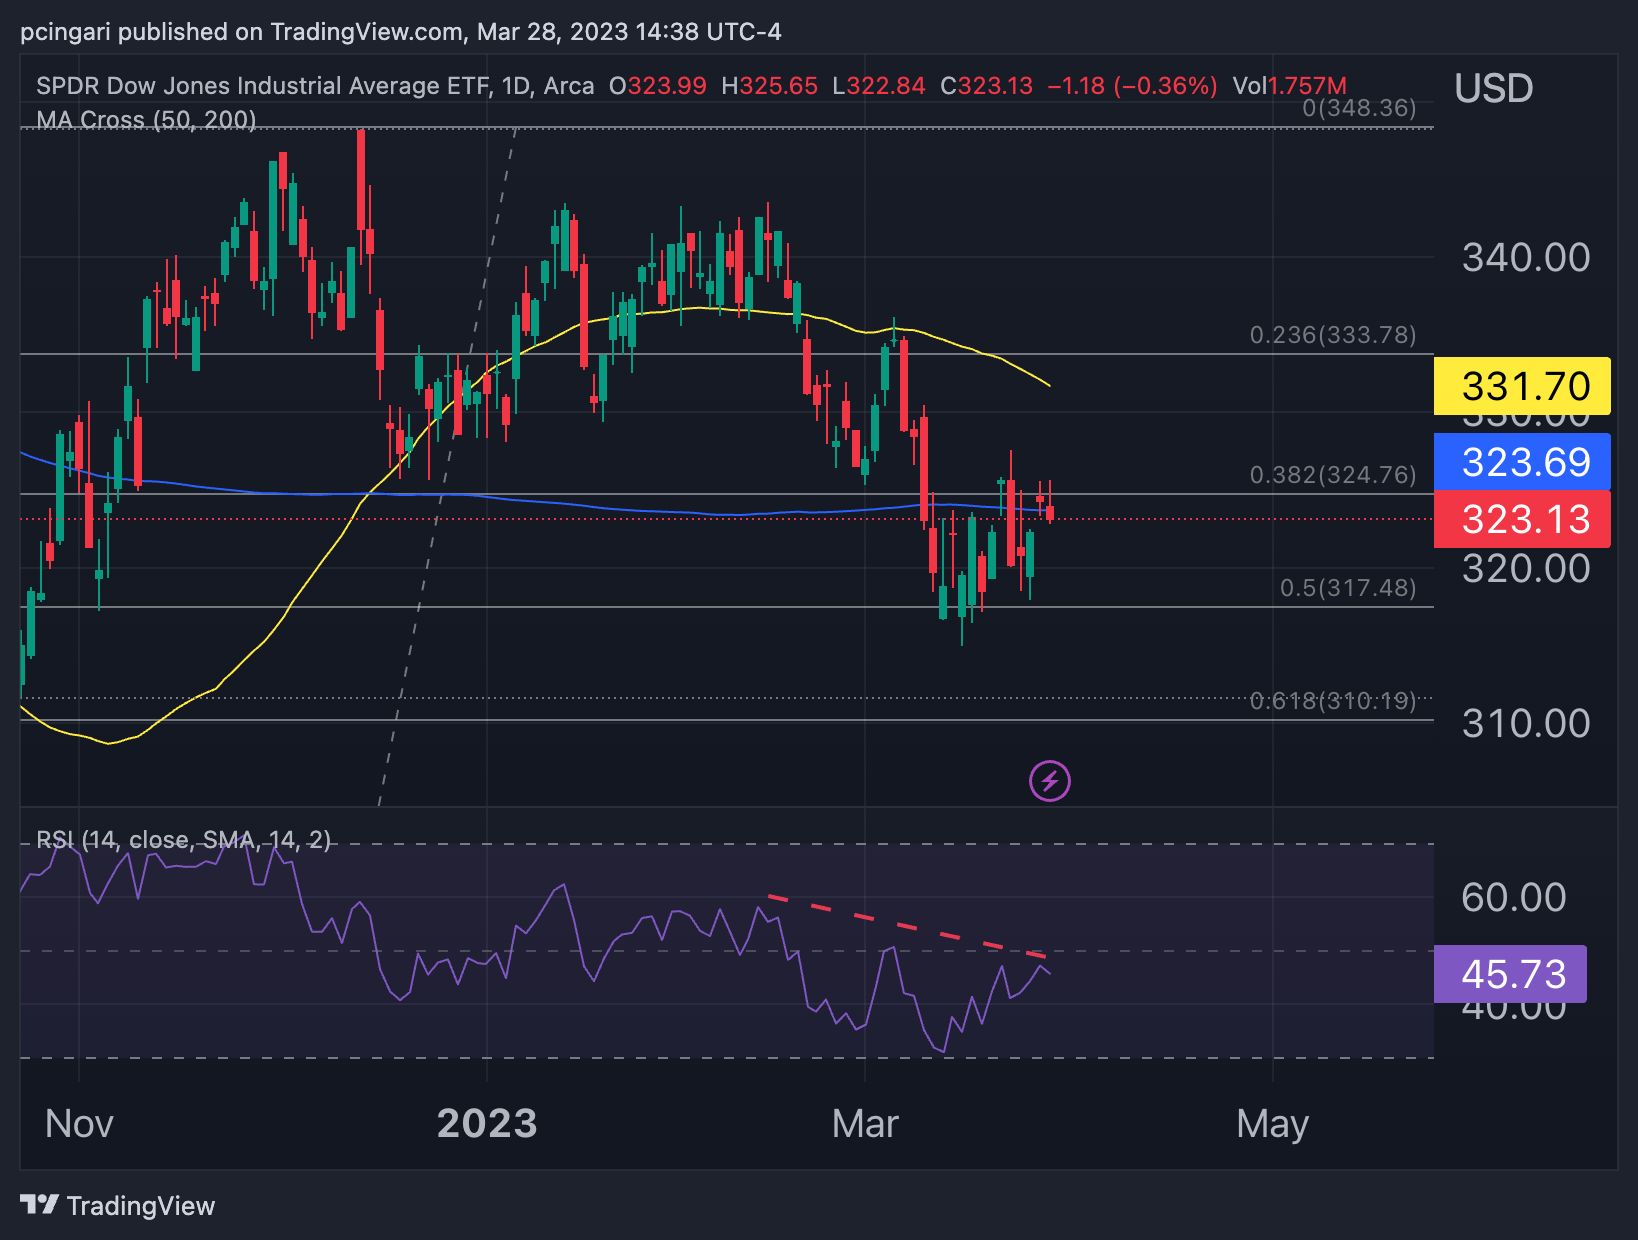
Looking at the daily chart, the short-term trend pendulum seems to be swinging to the sellers' side, as the 14-day relative-strength index (RSI), a key momentum indicator, has not broken above the 50 mark since mid-February.
DIA has currently retraced about 40% of the October-December 2022 low-to-high range.
If the DIA successfully breaks below the 200-dma support, the next critical technical support level would be between $315 (March 15 low) and $317.40 (50% Fibonacci retracement and November 2022).
This region might be tested in the coming days, if the overall risk sentiment remains fragile. Should sellers prevail there, a drop to $310 (61.8% Fibonacci retracement) would then be likely.

SPDR Dow Jones Industrial Average ETF Trust (DIA) 1-day – Chart: TradingView
Now Read: AMC Shares Pop On Amazon Takeover Rumors: The Details
© 2025 Benzinga.com. Benzinga does not provide investment advice. All rights reserved.
Trade confidently with insights and alerts from analyst ratings, free reports and breaking news that affects the stocks you care about.