The central factor in the collapse of the British pound has been the steady strengthening of the U.S. dollar. Other factors certainly are part of the mix that took the pound relentlessly down in September, but it’s mostly a “this currency is better than that currency” situation, and it’s been that way for a long time.
It’s as if traders and speculators finally gave up and said, “OK, that’s enough pain, just sell the position,” a sentiment sometimes seen when lows or near lows are within striking distance. Now that October’s relief rally in the pound is underway, maybe the downward momentum will ease.
Related: How to Trade Forex
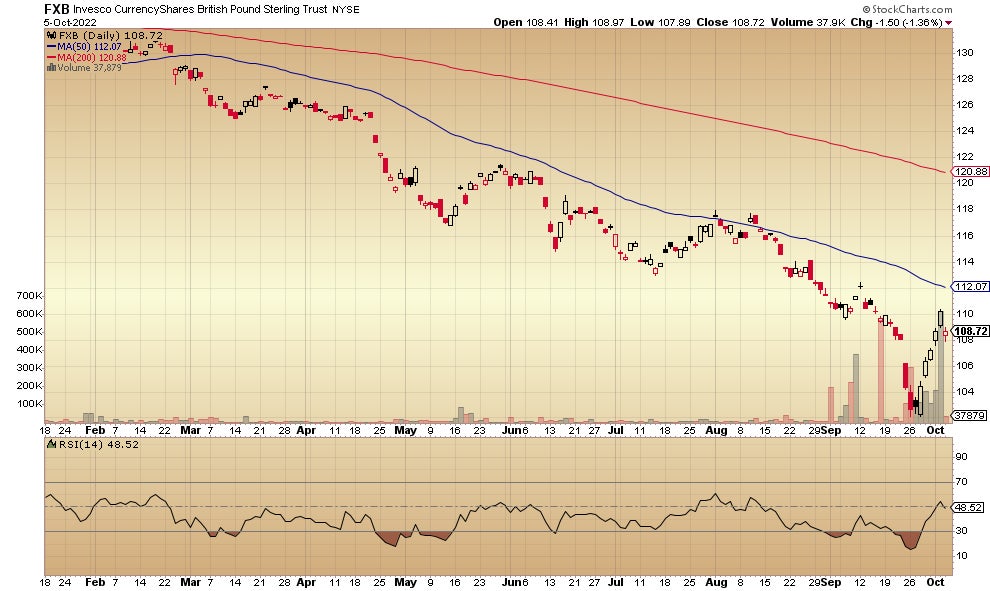
Here is the daily price chart for the Invesco Currency Shares British Pound Sterling Trust FXB, the exchange-traded fund (ETF) that closely tracks the pound:

The late September low was followed by five straight up days and then a retreat from buying. The price is having trouble crossing and staying above the declining 50-day moving average. Can this rebound finally take it there? The next upside target would be $118 on this chart, where previous buying gave way to more sellers.
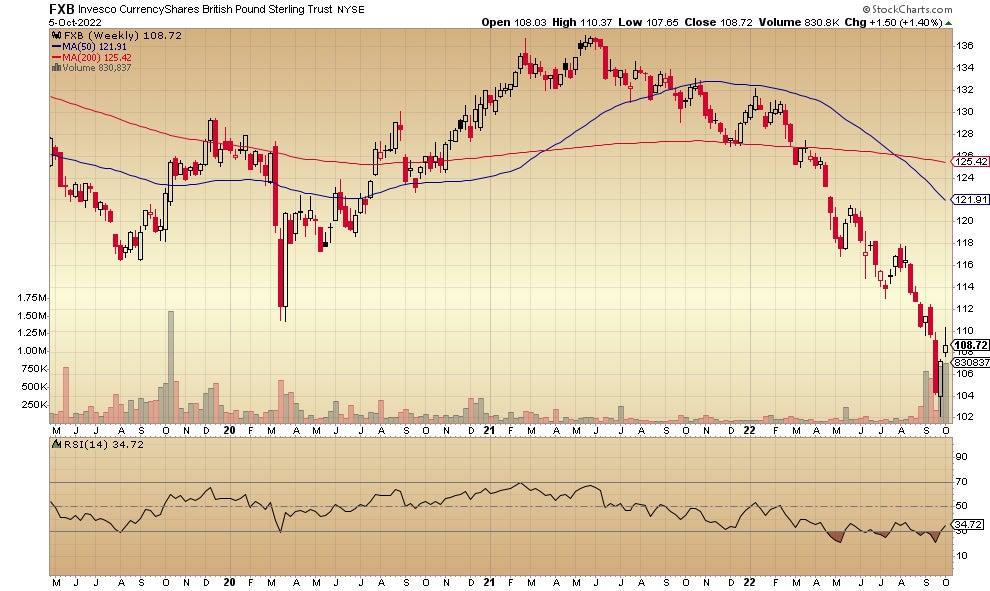
The weekly chart looks like this:

See also: What are Forex Indicators?
That’s a decline from $136 in May and June, 2021 to the low of $102 in late September, 2022, for a loss from the peak of 25%.
That’s a remarkable decline for what’s meant to be a relatively stable currency such as the pound. See how this recent drop takes the price to a lower low than the March 2020 pandemic scare sell-off. The trend downward is confirmed even as this October bounce moves the pound slightly higher.
That the 50-week moving average has crossed below the 200-week moving average is further confirmation.
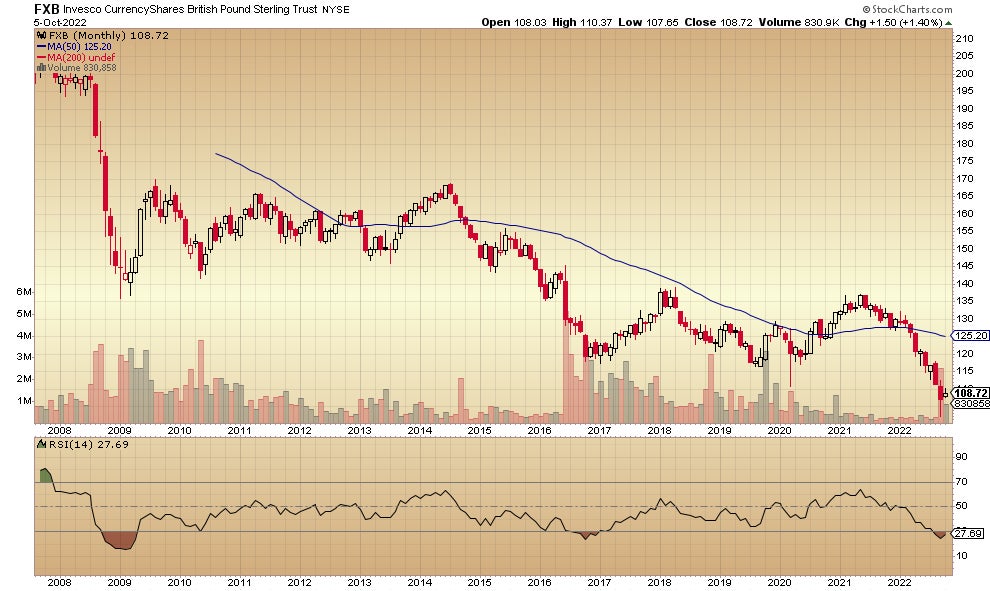
Take a look at the monthly chart:

The pound has been falling since at least 2008 with occasional short-lived rallies here and there along the way. It just keeps going lower as the years go by. This decline from early 2021 to the present is only the most recent example of the longer-term pattern. Currency would rather be in the dollar, it’s clear.
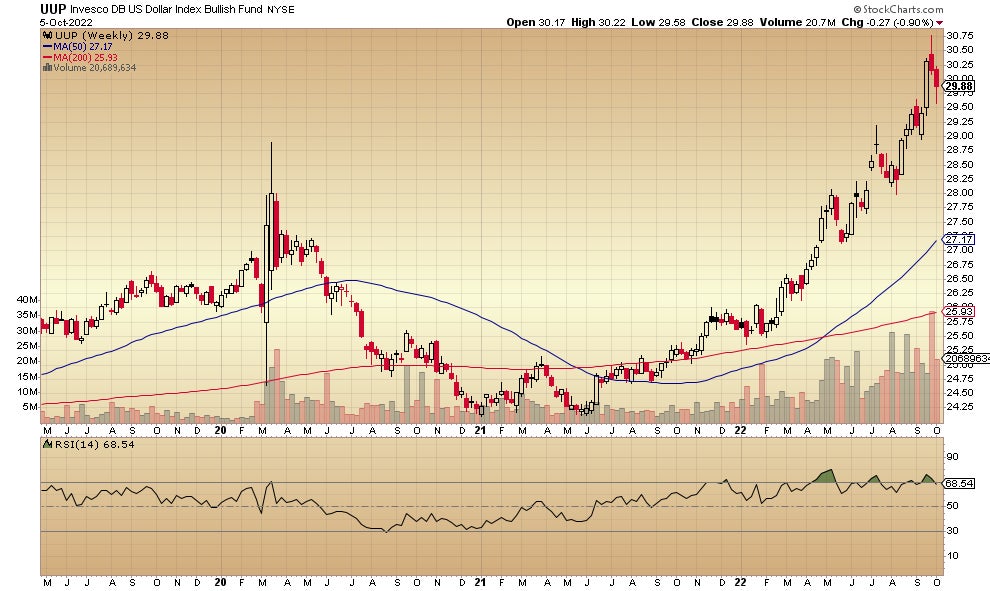
Here’s the weekly chart for the Invesco DB US Dollar Index Bullish Fund UUP.

It’s kind of the upside version of the British currency. Investors believe that the rising interest rates initiated by the Federal Reserve are good for the dollar and these attempts to tame inflation leave this currency as the last choice, better than bonds or equities.
Note that the price has risen so dramatically that it could still be in an uptrend on any sell-off down to the 50-day moving average at $27.
Benzinga has used the exchange-traded funds version of these currencies because they’re easy to trade (on the New York Stock Exchange) and they’re easy to chart.
Investors interested in capturing the greatest potential gains can also trade GBP/USD directly. Check out the list of Benzinga's Best Forex Brokers.
Not investment advice. For educational purposes only.
Charts courtesy of StockCharts
Edge Rankings
Price Trend
© 2025 Benzinga.com. Benzinga does not provide investment advice. All rights reserved.
Trade confidently with insights and alerts from analyst ratings, free reports and breaking news that affects the stocks you care about.