


Zinger Key Points
- Every chart offers lessons on technical analysis.
- The chart of XLV shows how resistance levels can convert into support levels.
- Feel unsure about the market’s next move? Copy trade alerts from Matt Maley—a Wall Street veteran who consistently finds profits in volatile markets. Claim your 7-day free trial now.
The chart of the Health Care Select Sector SPDR Fund XLV offers two valuable technical analysis lessons.
Technical analysis has a dubious reputation. Unfortunately, it is probably well-deserved.
Many analysts mindlessly attempt to identify patterns on charts without having an understanding of the price action that makes these patterns form. Even worse, some are proponents of bizzare techniques and methods that should be in the realm of science fiction instead of legitimate market analysis.
This is unfortunate because if understood and applied correctly, technical analysis is a study of market psychology and supply and demand dynamics, which can lead to profits.
Regardless of the security being analyzed, the same patterns appear on their charts. It could be a stock, a crypto, an ETF, a bond, a foreign currency, etc…
This is because the emotions and psychology of the traders in these various securities are reflected in the charts.
As you can see on the chart of XLV, levels around $147.00 were resistance in May and June. But in July this resistance was broken and the shares moved higher.
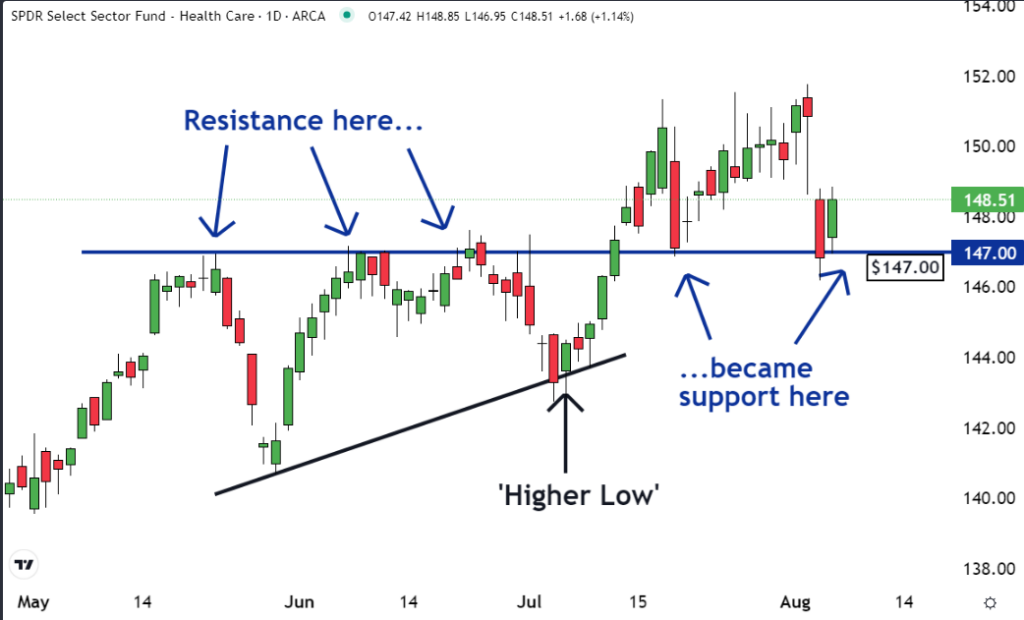 XLV " class="wp-image-479829" srcset="https://editorial-assets.benzinga.com/wp-content/uploads/2024/08/06142911/1-7-1024x620.png 1024w,https://editorial-assets.benzinga.com/wp-content/uploads/2024/08/06142911/1-7-300x182.png 300w,https://editorial-assets.benzinga.com/wp-content/uploads/2024/08/06142911/1-7-768x465.png 768w,https://editorial-assets.benzinga.com/wp-content/uploads/2024/08/06142911/1-7.png 1042w" sizes="(max-width: 1024px) 100vw, 1024px" />
Then there was some selling and profit-taking which pushed the price lower. And as you can also see that when this happened, the $147.00 level turned into support.
Resistance converting into support is a common occurrence in the financial markets. It is because many of the traders and investors who sold while the shares were at resistance came to regret their decision to do so when the price eventually moved higher.
Many of these remorseful sellers decided they made a mistake and vowed to buy their shares back.
But they will only do so if they can get them for the same price they were sold at. So, when the price returns to the level that had previously been resistance, they place buy orders. If there are enough of these orders it will convert what was resistance into support.
That is what happened at the $147.00 level with XLV.
Another lesson the chart offers is the “higher low.” Markets rarely go in straight lines. They tend to form a series of peaks and valleys. When the valley forms at a higher price than the previous one, traders say it is a “higher low.”
This is an illustration of buyers becoming more aggressive. As time passes, they are willing to pay higher prices.
When a market reaches a resistance level, like XLV did in July, traders can gain insight into whether or not the resistance will break by looking for higher lows. If they did occur within the trend before it reached resistance, there is a good chance the resistance will break.
As time has passed, the buyers have become increasingly aggressive and this could be a setup for a move higher. Every chart can provide valuable lessons in technical analysis when traders recognize that they reflect market psychology and supply and demand dynamics.
Read Next:
Image created using artificial intelligence via Midjourney.
Edge Rankings
Price Trend
© 2025 Benzinga.com. Benzinga does not provide investment advice. All rights reserved.
Trade confidently with insights and alerts from analyst ratings, free reports and breaking news that affects the stocks you care about.

