Aytu Biosciences Inc. AYTU shares gapped up Thursday morning. The price jump is speculatively from the meetings the company is having about the proposed merger with Neos Therapeutics Inc. NEOS.

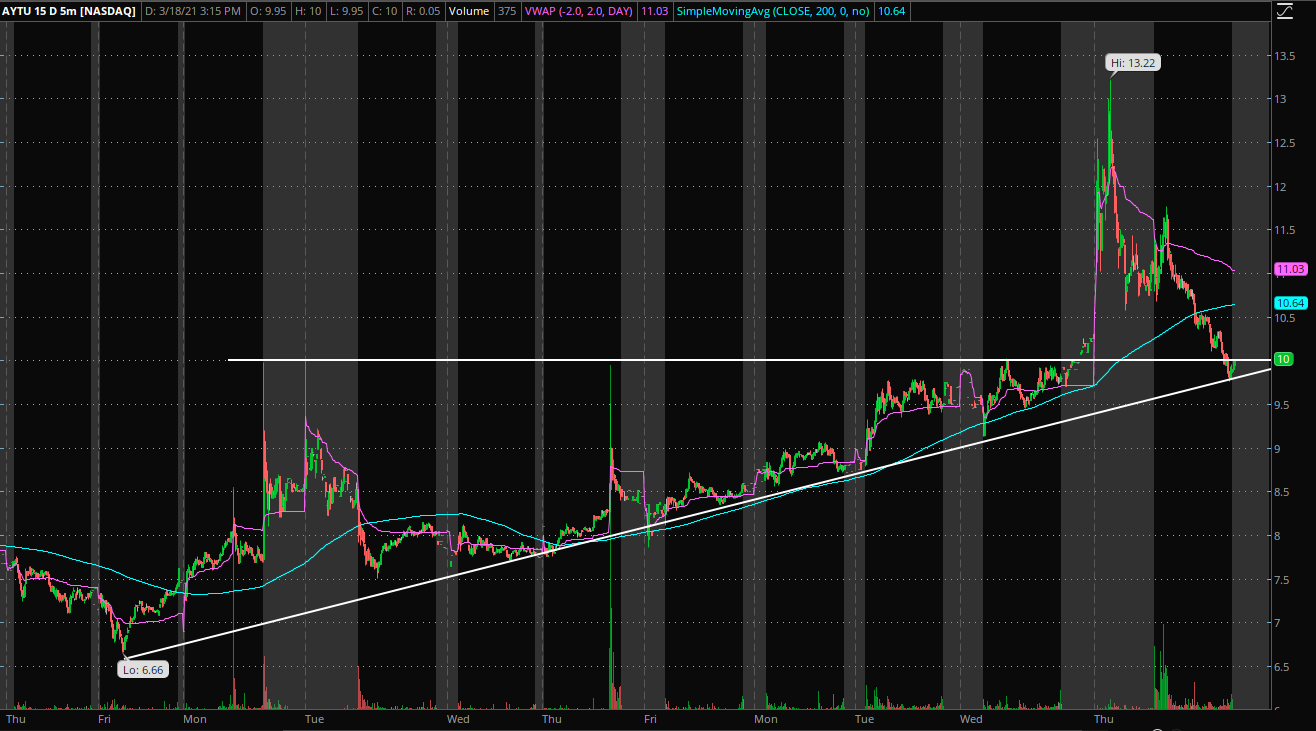
Aytu Short Term Chart Analysis: The 5-minute chart above shows the stock has built higher lows throughout the week and last up to a resistance level of $10. The stock broke out of the resistance level and is now falling back to support. The stock could test the potential support and find a bounce near the trendline from connecting the lows on the chart.
The stock is currently trading below both the 200-day moving average (blue) and the volume-weighted average price (pink), giving the stock a short-term bearish sentiment. These indicators may act as potential resistance lines in the future.

Aytu Daily Chart Analysis: The stock has been building higher lows that can be seen on the daily chart above. This area that connects these lows may be seen as potential support.
$10 looks as though it's a key level as it previously held as support before the stock fell below. Now, this key level may be thought of as potential resistance since the stock has started to work its way back to the resistance level. It gapped over the level and sold off back to below.
Bulls make like to see the stock break above the $10 resistance with a period of consolidation before the stock may make a higher move. Bears would like to see the stock stay below the $10 mark and would like to see the stock stop forming higher lows on the daily chart.
Aytu Price Action: The stock trades with a market cap of $173 million and a public float of 14.7 million shares. The stock closed Thursday up 0.82% at $9.88.
Edge Rankings
Price Trend
© 2025 Benzinga.com. Benzinga does not provide investment advice. All rights reserved.
Trade confidently with insights and alerts from analyst ratings, free reports and breaking news that affects the stocks you care about.