Ocugen Inc. OCGN shares were trading higher Thursday in sympathy with other coronavirus vaccine stocks.
Vaccine stocks are likely moving after Moderna Inc. MRNA reported the vaccine saw 93% efficacy six months after the second dose.
Ocugen was up 10.31% at $7.49 at the close Thursday. 
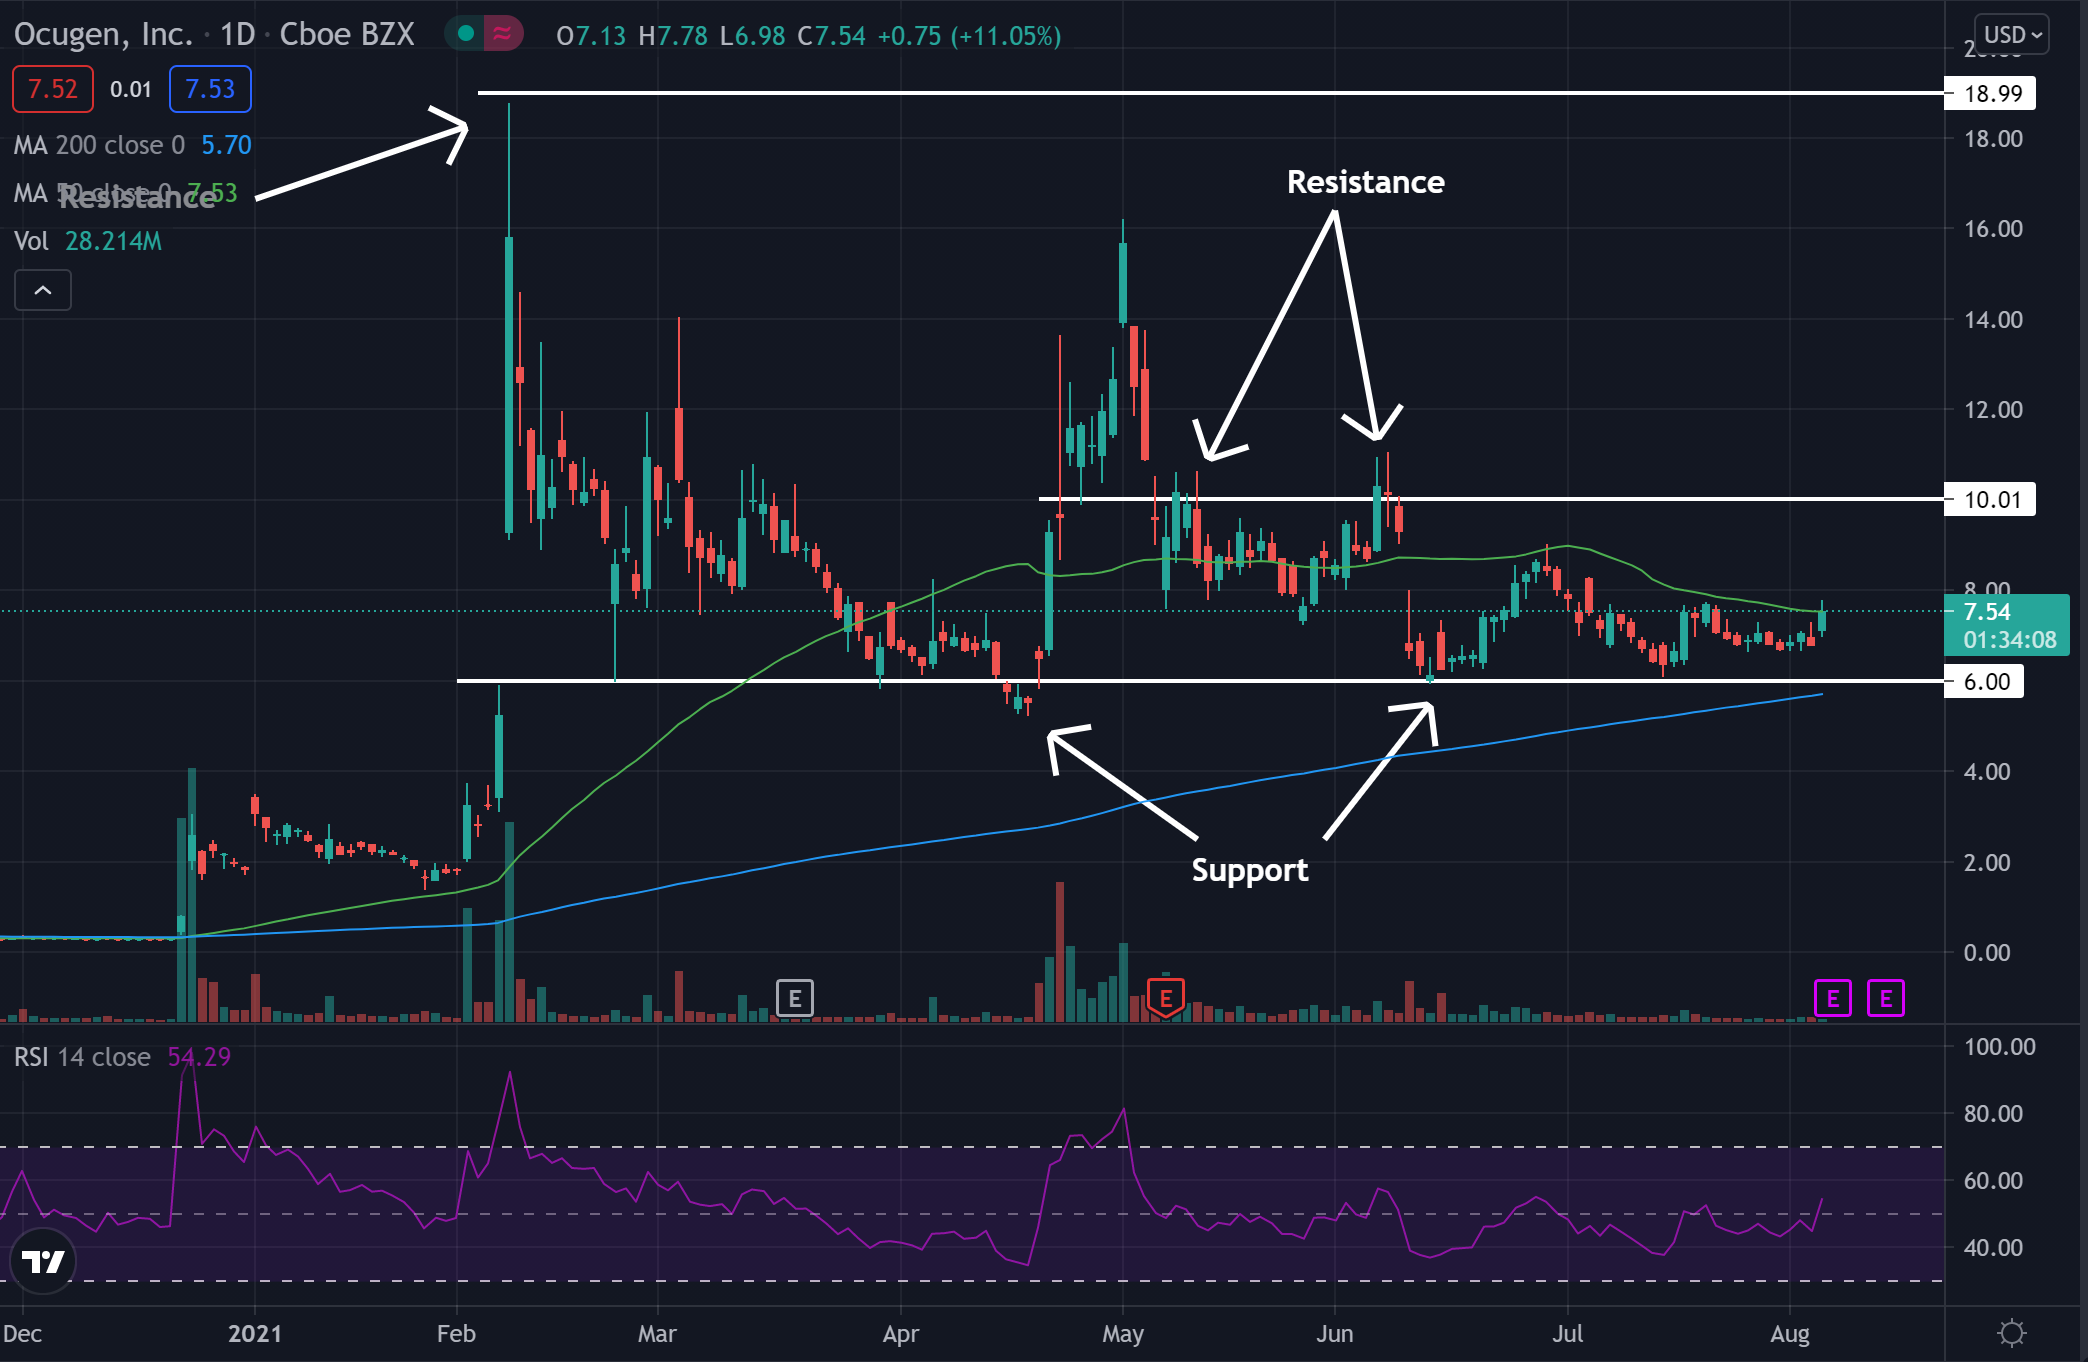
Ocugen Daily Chart Analysis
- Shares look like they may have found a bottom within a sideways channel and are now heading back higher.
- The stock is trading below the 50-day moving average (green), but above the 200-day moving average (blue), indicating the stock is likely in a period of consolidation.
- The 50-day moving average may hold as resistance in the future unless price can break above on strong volume. The price is nearing the 50-day moving average Thursday. The 200-day moving average may hold as support.
- The stock is showing a $6 support level in the channel and a $10 resistance from the channel. Above the $10 mark, the stock may not find strong resistance until it reaches $19.
- The Relative Strength Index (RSI) saw a jump Thursday and crossed above the middle line. The RSI now sits at 54, meaning there are now more buyers in the stock than sellers.
What’s Next For Ocugen?
Bullish traders would like to see the stock build higher lows up to the $10 resistance. Bulls then would like to see the stock break over the $10 resistance and be able to hold above it.
Bears would like to see the stock turn around and start falling. Bears would like to see the stock fall below the $6 support level first, and then below the 200-day moving average.
© 2025 Benzinga.com. Benzinga does not provide investment advice. All rights reserved.
Trade confidently with insights and alerts from analyst ratings, free reports and breaking news that affects the stocks you care about.