Zinger Key Points
- Johnson & Johnson's stock shows bearish pressure ahead of Q3 earnings, trading below key moving averages despite MedTech growth.
- The V-Wave acquisition strengthens J&J’s portfolio, but setbacks in drug trials and diluted EPS forecasts weigh on investor sentiment.
- Get the Real Story Behind Every Major Earnings Report
Johnson & Johnson JNJ is set to announce its third quarter earnings on Oct. 15 before the market opens. Wall Street is expecting the pharmaceutical and healthcare giant to post earnings per share (EPS) of $2.21 and revenue of $22.16 billion.
But while J&J's numbers are in focus, recent headlines about its MedTech acquisitions and drug trial halts are stealing the spotlight.
MedTech Grows, Drug Trials Stumble
Johnson & Johnson recently completed its acquisition of V-Wave, adding a minimally invasive cardiovascular treatment to its MedTech portfolio. The Ventura Interatrial Shunt is expected to strengthen J&J's position in tackling heart failure, but the acquisition comes with a short-term cost. The company has warned that this move will dilute adjusted EPS by around 24 cents in 2024 and 6 cents in 2025, an update they'll likely address in Tuesday’s earnings report.
On the flip side, the company had to discontinue its Phase 3 SunRISe-2 trial, which was investigating a treatment for muscle-invasive bladder cancer. The trial didn't show superiority over chemoradiation, leading to its early termination, though J&J remains optimistic about the future of its TARIS platform, forecasting a $5 billion potential.
The Charts Are Sending Mixed Signals
Despite some positive news in the MedTech arena, Johnson & Johnson’s stock has had a relatively stagnant year, up just 0.93% year-to-date and only 2.49% over the past year. But in the past six months, the stock has seen a 9.40% rise, reflecting a slow but steady recovery.

Chart created using Benzinga Pro
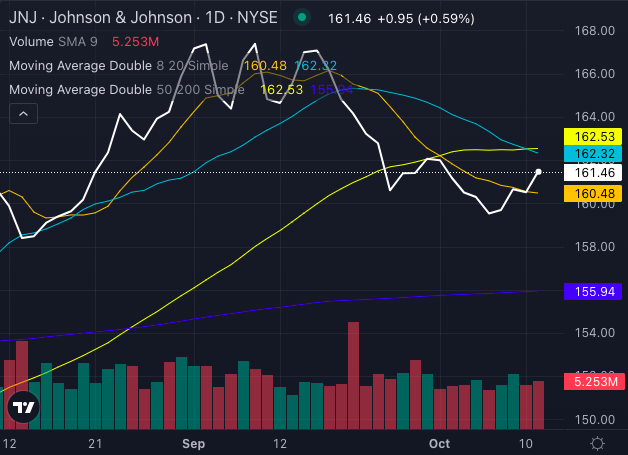
At its current price of $161.46, JNJ stock is just above its eight-day simple moving average of $160.48, a positive sign. However, the stock is lagging behind its 20-day and 50-day simple moving averages, sitting at $162.32 and $162.53, respectively. This signals some underlying selling pressure that may persist in the near term.
Read Also: What Analysts Are Saying About Johnson & Johnson Stock

Chart created using Benzinga Pro
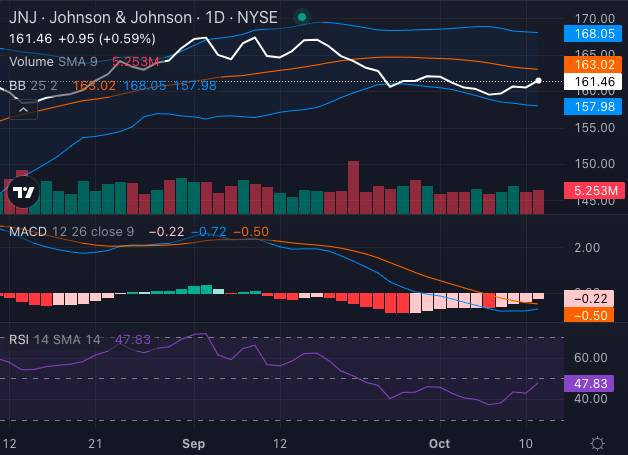
The Moving Average Convergence/Divergence (MACD) indicator at a negative 0.72 leans toward bearishness, hinting at continued downward pressure. Meanwhile, JNJ stock's Relative Strength Index (RSI) of 47.83 suggests the stock is in neutral territory.
The Bollinger Bands show a range between $157.98 and $168.05, with JNJ stock nestled in the lower bearish band. This positioning could suggest that the stock is poised for a bounce, but given the selling pressure, caution is warranted.
Can Q3 Earnings Change The Tune?
All eyes will be on J&J's third-quarter earnings report. Investors are particularly interested in any updates to the company's guidance following the V-Wave acquisition and the ongoing performance of its MedTech and Innovative Medicine segments.
Johnson & Johnson's charts may not be flashing strong bullish signals, but its strategic moves in MedTech and future product pipeline could offer long-term growth potential.
Investors will have to weigh the upcoming earnings report to see if J&J stock can shake off recent pressures and revitalize its performance.
Read Next:
Photo: Shutterstock
© 2025 Benzinga.com. Benzinga does not provide investment advice. All rights reserved.
Trade confidently with insights and alerts from analyst ratings, free reports and breaking news that affects the stocks you care about.