


Zinger Key Points
- Novartis shows strong bullish momentum, while AbbVie remains range-bound ahead of its Q4 earnings reports.
- Investors should watch key resistance levels — ABBV above $177 and NVS above $106 — for potential post-earnings moves.
- Today's manic market swings are creating the perfect setup for Matt’s next volatility trade. Get his next trade alert for free, right here.
As AbbVie Inc. ABBV and Novartis AG NVS prepare to report their fourth-quarter earnings before market open on Friday, investors are eyeing the technical setups of both pharmaceutical giants.
While AbbVie is stuck in a stagnating trend, Novartis appears to have a stronger bullish momentum.
Let's break down the charts.
AbbVie: Caught In Neutral Gear
AbbVie's technical setup presents mixed signals.
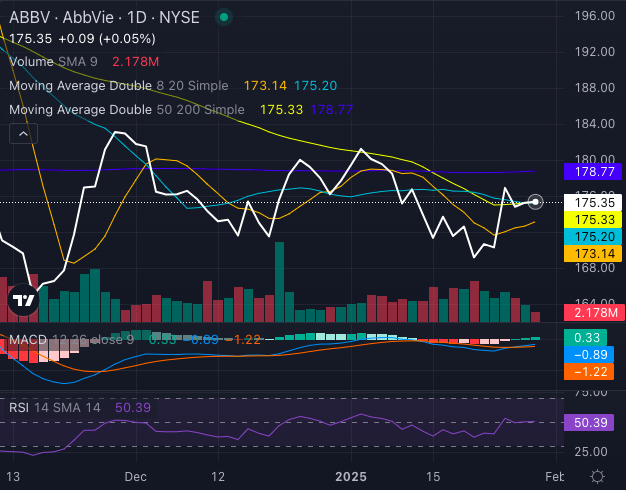
Chart created using Benzinga Pro
AbbVie stock is trading above its short-term moving averages, with the eight-day ($173.14) and 20-day ($175.20) SMAs (simple moving averages) flashing bullish indicators. However, longer-term trends tell a different story — AbbVie stock is aligned closely against its 50-day ($175.33) SMA and below its 200-day ($178.77) SMA, suggesting lingering downside pressure. The MACD (moving average convergence/divergence) indicator at a negative 0.89 reinforces this bearish bias, while the RSI (relative strength index) at 50.39 indicates neutral momentum.
Overall, AbbVie is struggling for direction, with slight selling pressure keeping a lid on any breakout potential. A strong earnings beat could push the stock past key resistance levels, but the current setup suggests AbbVie is vulnerable to further consolidation.
Novartis: Riding A Bullish Wave
Novartis, on the other hand, is trending decisively higher.
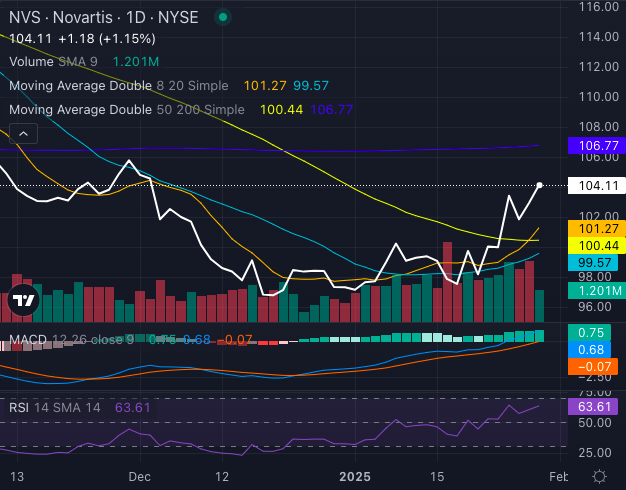
Novartis is trading above its short-term and mid-range moving averages, with the eight-day ($101.27), 20-day ($99.57), and 50-day ($100.44) SMAs all acting as support. The MACD at 0.68 points to bullish momentum, while the RSI at 63.61 shows strength without being overbought.
However, the stock remains below its 200-day SMA ($106.77), leaving some room for caution.
Investor Implications
Heading into earnings, Novartis holds the technical advantage, displaying a stronger bullish structure and upward momentum. AbbVie, meanwhile, remains stuck in a range, needing a catalyst to break higher.
Investors should watch key resistance levels — AbbVie above $177 and Novartis above $106 — for signs of further movement post-earnings.
Read Next:
Photo: Romix Image via Shutterstock
Edge Rankings
Price Trend
© 2025 Benzinga.com. Benzinga does not provide investment advice. All rights reserved.
Trade confidently with insights and alerts from analyst ratings, free reports and breaking news that affects the stocks you care about.

