


Zinger Key Points
- Merck is battling selling pressure, but strong analyst targets suggest upside potential.
- Pfizer faces a bearish trend with minimal upside, though analysts expect a moderate gain.
- China’s new tariffs just reignited the same market patterns that led to triple- and quadruple-digit wins for Matt Maley. Get Matt’s next trade alert free.
Merck & Co Inc MRK and Pfizer Inc PFE are duking it out for investor attention with fourth-quarter earnings being reported on Tuesday.
Both pharmaceutical heavyweights have very different technical setups, leaving investors to wonder which stock will have the upper hand.
Let's break down the charts and what the technical signals are saying about each company as they prepare to report.
Merck Stock's Mixed Signals: Bullish Short-Term, But Long-Term Resistance Looms
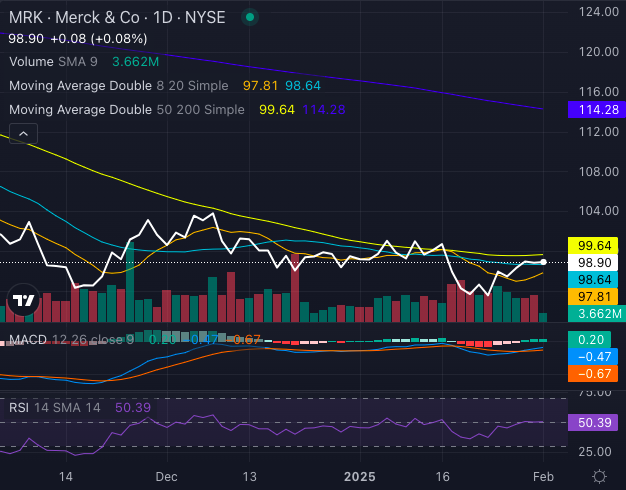
Chart created using Benzinga Pro
Merck stock has shown some solid short-term strength, with its stock price of $98.90 comfortably sitting above its eight-day and 20-day simple moving averages (SMAs) of $97.81 and $98.64, respectively. These short-term buying signals, along with a neutral Relative Strength Index (RSI) of 50.39, suggest a continuation of the current trend, barring any earnings surprises.
However, the story changes when looking at Merck stock’s long-term trend. Its 50-day SMA of $99.64 and 200-day SMA of $114.28 are higher than its stock price, indicating that the stock may face resistance moving forward. Merck’s Moving Average Convergence Divergence (MACD) of a negative 0.47 suggests bearish momentum in the near term, adding an element of risk.
On the flip side, analysts are bullish on Merck with a consensus target of $124, representing an implied upside of 20.25%. That positive outlook could be enough to offset the short-term technical pressure, making Merck stock a bit of a mixed bag heading into earnings.
Pfizer Stock's Bearish Downtrend: Can It Overcome The Struggles?
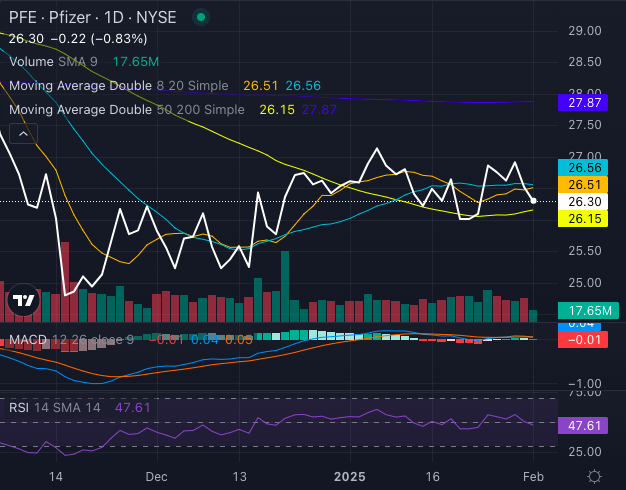
Chart created using Benzinga Pro
In stark contrast, Pfizer stock is looking much weaker technically. The stock has been firmly entrenched in a bearish trend, with its share price sitting below its five-, 20- and 50-day exponential moving averages (EMAs), signaling ongoing selling pressure. Pfizer stock at $26.30 has eight-day SMA at $26.51 and the 20-day SMA at $26.56, both signals pointing to potential further downside.
Pfizer stock's 50-day SMA of $26.15 provides some minor support, but overall, the chart points to more trouble ahead. The MACD indicator of 0.04 shows only a glimmer of bullish potential, while the RSI of 47.61 reinforces the neutral sentiment surrounding the stock. While there's a chance for some short-term recovery, Pfizer's overall trajectory looks weaker than Merck's.
Despite the challenges, Pfizer's analyst consensus price target is $36.74, offering an implied upside of 13.80%. However, with the Pfizer stock trading significantly below its 200-day SMA of $27.87, it's clear Pfizer has a tough road ahead.
Merck Vs. Pfizer: Who Will Win The Earnings Showdown?
When it comes to earnings, Merck's solid analyst outlook and bullish short-term signals seem to give it the edge over Pfizer, which is struggling with technical bearishness.
While both stocks face risks, Merck's upside potential, supported by a 20% price target boost from analysts, makes it the more promising candidate for investors looking for stability and growth.
Pfizer, on the other hand, remains a riskier play, though it does offer some upside potential if it can overcome its technical hurdles.
Read Next:
Photo: Merck: Zah108; Pfizer: Vadi Fuoco
Edge Rankings
Price Trend
This content was partially produced with the help of AI tools and was reviewed and published by Benzinga editors.
Market News and Data brought to you by Benzinga APIs© 2025 Benzinga.com. Benzinga does not provide investment advice. All rights reserved.
Trade confidently with insights and alerts from analyst ratings, free reports and breaking news that affects the stocks you care about.

