Zinger Key Points
- Paramount’s stock remains bullish, trading above key moving averages and Bollinger Bands.
- Watch for resistance around the 200-day SMA at $12.54 and support near the 50-day SMA at $11.70.
- The new Benzinga Rankings show you exactly how stocks stack up—scoring them across five key factors that matter most to investors. Every day, one stock rises to the top. Which one is leading today?
Paramount Global PARA saw a 3.13% dip by 11 AM ET on Monday as investors digested the merger announcement with Skydance Media.
Here's what the technical indicators say about the stock's future.
Bullish Indicators
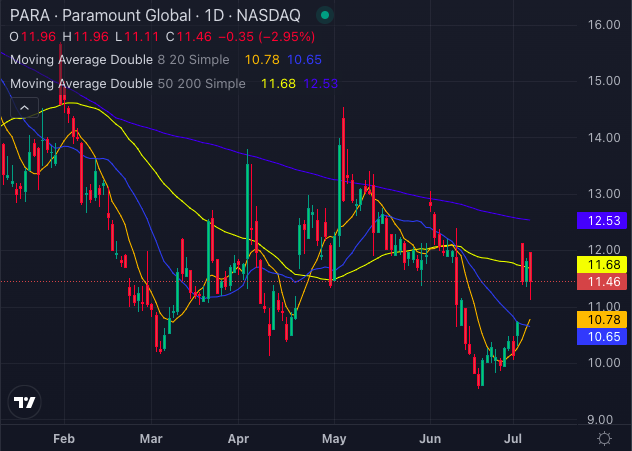
Despite the recent news, the technical outlook for Paramount stock remains intriguing. The stock is currently trading above its 5, 20, and 50-day exponential moving averages, signaling strong bullish momentum.

Chart created using Benzinga Pro
Read Also: Paramount Global And Skydance Media Ink $28B Merger, Forming New Entity
Here's a closer look:
- Simple Moving Averages: PARA's share price of $11.46 is comfortably above its 8-day SMA ($10.78), 20-day SMA ($10.65), and 50-day SMA ($11.68), all reinforcing a bullish trend.

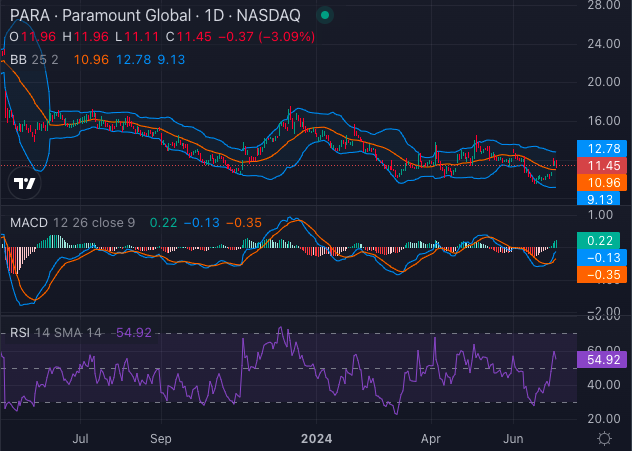
Chart created using Benzinga Pro
- Bollinger Bands: The 25-day Bollinger Bands, ranging from $9.13 to $12.78, suggest buying opportunities, indicating potential price support and volatility levels.
Cautionary Signals
However, not all indicators are flashing green. Several metrics suggest the need for cautious optimism:
- 200-Day SMA: The 200-day simple moving average at $12.53 currently creates a bearish signal, indicating potential resistance at higher levels.
- MACD and RSI: The Moving Average Convergence Divergence (MACD) indicator at -0.13 suggests bearish sentiment, while the Relative Strength Index (RSI) at 54.92 and heading northwards, indicates that the stock could approach overbought territory at 70.
What's Next?
As Paramount navigates through the merger process, the technical setup shows mixed signals:
- Support and Resistance Levels: Key support is seen around the 50-day SMA at $11.68, with resistance at the 200-day SMA at $12.53.
- Potential Catalysts: The merger could bring new dynamics, but for now, the technical picture suggests that bulls have the upper hand. Traders should watch for breakout movements above the 200-day SMA or potential pullbacks to the support levels.
While the merger with Skydance Media introduces new variables, the technical indicators for Paramount Global suggest a bullish bias in the short term, with key levels to watch for potential entry points or exits.
Read Next:
Image: Shutterstock
Edge Rankings
Price Trend
© 2025 Benzinga.com. Benzinga does not provide investment advice. All rights reserved.
Trade confidently with insights and alerts from analyst ratings, free reports and breaking news that affects the stocks you care about.