


Zinger Key Points
- GameStop is trading in an uptrend, making a consistent series of higher highs and higher lows.
- The stock reached an all-time high of $120.75 two years ago on Jan. 28, 2020.
- China’s new tariffs just reignited the same market patterns that led to triple- and quadruple-digit wins for Matt Maley. Get the next trade alert free.
GameStop Corporation GME was sliding over 5% on Monday in consolidation after surging about 14% on Friday.
The gaming retailer hit the two-year anniversary of its historic stock squeeze on Saturday. On Jan. 28, 2020, GameStop peaked at a split-adjusted price of $120.75, a price the stock hasn’t come near to trading at since.
That squeeze, which came in tandem with short squeezes in numerous other stocks, put the spotlight on retail traders versus Wall Street and set the stage for ongoing debates and discussions that would take place everywhere — from dining room tables, to internet chat groups to the U.S. Congress.
Although the popularity of GameStop has waned, interest in other retail favorites remains high and short squeezes continue to take place.
StockTwits CEO On Retail Trader Revolution: StockTwits CEO Rishi Khanna doesn’t see the battle between retail and institutional investors ending anytime soon.
“The discovery and push/pull between the bears and the bulls is still there, driving the meme stock conversation despite current volatility,” Khanna told Benzinga.
The three main characteristics that retail traders look for when choosing where to pick a fight with Wall Street are that a company is a popular brand name, has bankruptcy rumors surrounding it or bankruptcy filings and high short interest, he told Benzinga.
Why GameStop Short Squeeze Is Unlikely: Although GameStop had the perfect recipe for a short squeeze in 2020, the stock’s institutional ownership and short interest levels have dropped drastically, making another massive short squeeze in the near term unlikely.
With that being said, GameStop has soared almost 40% since Jan. 6, providing good profits for traders who took a position near the start of 2023 and subsequently sold.
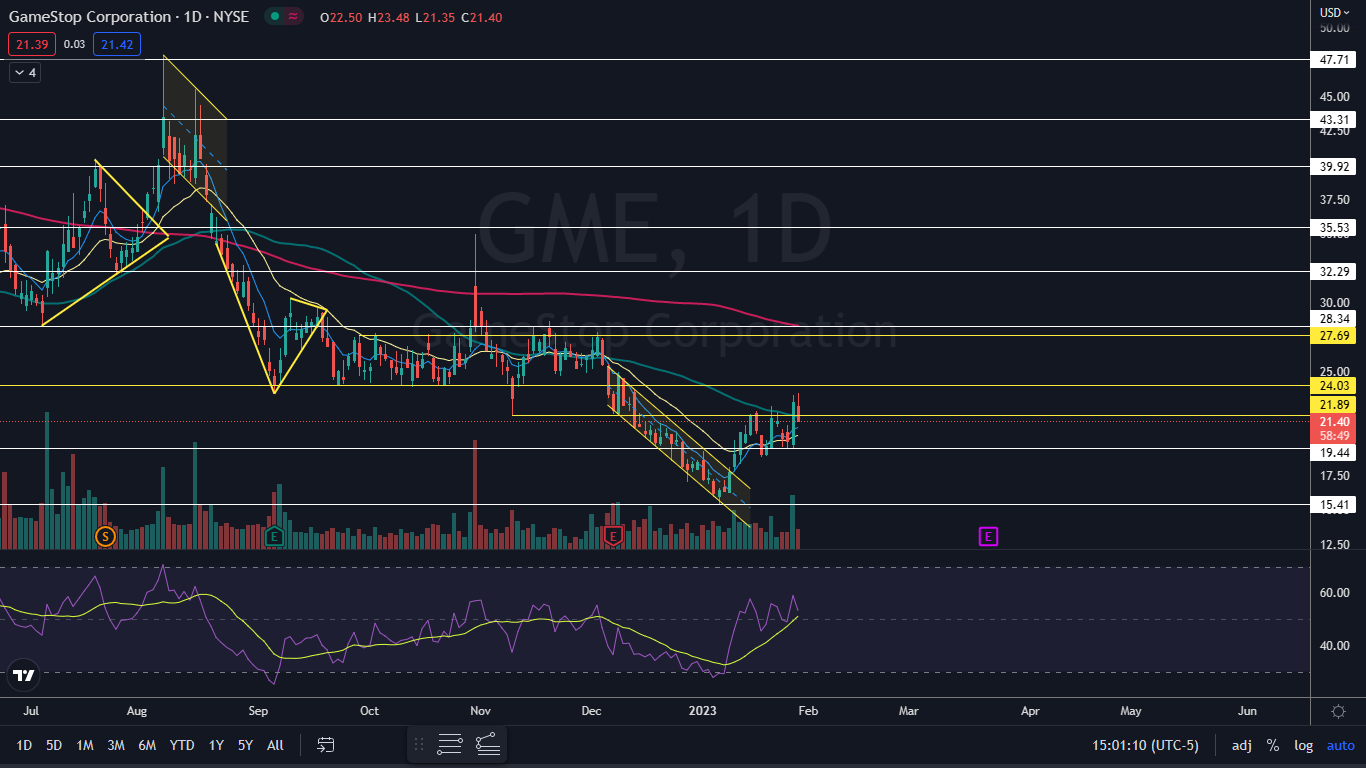
For traders hoping to see higher prices, GameStop is showing signs of a continued reversal to the upside, having settled into a strong and consistent uptrend on the daily chart.
Want direct analysis? Find me in the BZ Pro lounge! Click here for a free trial.
The GameStop Chart: GameStop reversed into an uptrend on Jan. 6 and has since made a consistent series of higher highs and higher lows. GameStop’s most recent higher low was formed on Jan. 26 at $19.38 and the most recent confirmed higher high was printed at the $22.49 mark on Jan. 23.
- On Friday and Monday, GameStop shot up above the most recent higher high but hasn’t yet confirmed the next local top has occurred. If GameStop continues to fall on Tuesday, Monday’s high-of-day at $23.48 will be the next confirmed higher high.
- On Monday, GameStop was working to print a shooting star candlestick and an inside bar pattern. The shooting star candlestick is bearish, but because it was forming near the top of Friday’s mother bar, the overall pattern is neutral for the short term.
- Bullish traders want to see GameStop break up from the inside bar pattern on Tuesday or for the stock to trade lower but reverse to the upside near the $20 mark, which would indicate the uptrend remains intact.
- Bearish traders want to see big bearish volume come in and break GameStop down from Friday’s mother bar, which would negate the uptrend.
- GameStop has resistance above at $21.89 and $24.03 and support below at $19.44 and $15.41.
 Read Next: How Much $100 In AMC, Gamestop Would Be Worth If Stocks Hit Highs From Meme-Trade Halts 2 Years Ago
Photo via Shutterstock.
Edge Rankings
Price Trend
© 2025 Benzinga.com. Benzinga does not provide investment advice. All rights reserved.
Trade confidently with insights and alerts from analyst ratings, free reports and breaking news that affects the stocks you care about.

