Zinger Key Points
- Wall Street expects GameStop to report a second quarter loss of nine cents per share with $895.67 million in revenue.
- Despite bullish technical indicators, analysts maintain a bearish outlook, with price targets significantly below current levels.
- China’s new tariffs just reignited the same market patterns that led to triple- and quadruple-digit wins for Matt Maley. Get the next trade alert free.
GameStop Corp GME will be reporting its second-quarter earnings on Tuesday. Wall Street expects a loss of nine cents per share and $895.67 million in revenues as the company reports after market hours.
In recent quarters, retailers like GameStop have reported lower spending on discretionary items, including video games, as Americans face rising prices for essentials and prioritize value. GameStop, which saw significant volatility in the first half of 2024 due to its meme stock status, has experienced a calmer summer.
Earlier this year, the retailer issued millions of new shares. Recently, GameStop announced plans to tap into gamer nostalgia by converting some stores into “retro” locations, focusing on older consoles and games.
The stock is up 42.48% over the past year, 45.47% YTD.
Let’s look at what the charts indicate for GameStop stock and how the stock currently maps against Wall Street estimates.
GameStop Stock Chart Strongly Bullish Ahead Of Q2 Earnings
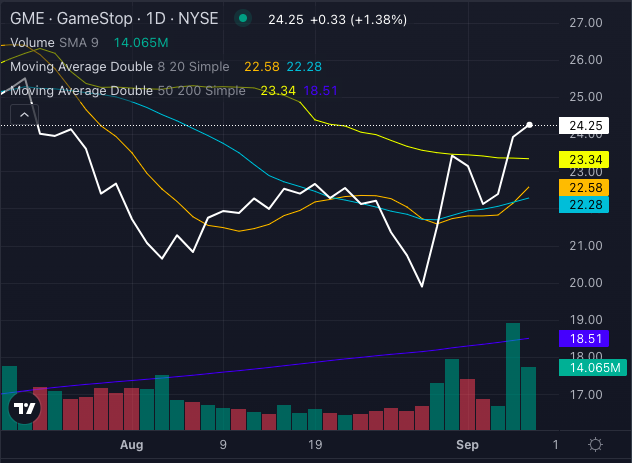
GameStop stock is demonstrating strong bullish momentum, with its share price of $24.25 trading above key moving averages, including the five, 20 and 50-day exponential moving averages, indicating slight buying pressure.

Chart created using Benzinga Pro
The stock is trading above its eight-day simple moving average (SMA) of $22.58, 20-day SMA of $22.28, and 50-day SMA of $23.34, all signaling a bullish trend.
Additionally, GameStop stock is well above its 200-day SMA of $18.51, further reinforcing the bullish outlook.

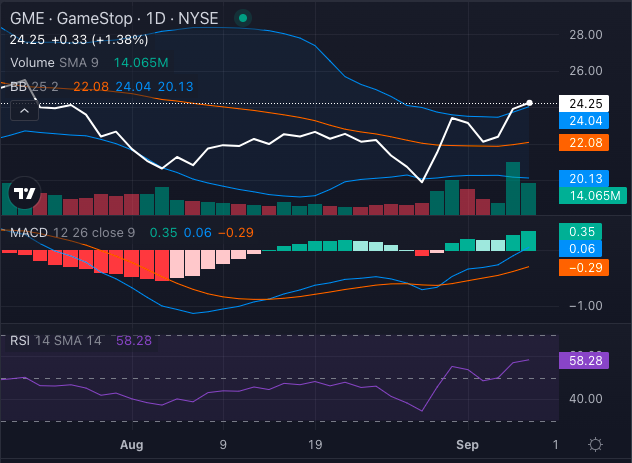
Chart created using Benzinga Pro
The MACD (Moving Average Convergence/Divergence) reading of 0.06 supports this bullish signal, while the RSI at 58.28 suggests the stock is heading towards overbought territory.
Bollinger Bands ($20.13 – $24.04) also confirm a bullish signal as the price nears the upper range limit. Overall, GME is technically positioned for continued bullish movement.
However, analysts do not seem to conform to this view.
Yet GameStop Analysts See Major Downside
GameStop Ratings & Consensus Estimates: The consensus analyst rating on GameStop stock stands at a Sell with a price target of $17 a share. Analysts at Wedbush have a price target of $11 on the stock, implying a downside of over 50% from current levels.
GME Stock Price Action: GameStop stock closed at $24.25, up 1.38% on Monday.
Read Next:
Photo: Shutterstock
Edge Rankings
Price Trend
© 2025 Benzinga.com. Benzinga does not provide investment advice. All rights reserved.
Trade confidently with insights and alerts from analyst ratings, free reports and breaking news that affects the stocks you care about.