Moderna, Inc MRNA and Novavax, Inc NVAX were trading up over 10% and 8%, respectively, at one point on Wednesday, boosted by the S&P 500’s almost 2.6% intraday gain.
The pharmaceutical stocks have been heavily beaten down over the past many months, with Moderna declining over 70% from its Aug. 10, 2021 all-time high of 497.49 and Novavax plummeting about 76% from its all-time high of 331.68 printed on Feb. 9 of that same year, when the COVID-19 pandemic plagued the global community.
Both Moderna and Novavax have started to flash signals the bottom may be in, because they have developed various bullish indicators on their daily charts.
It should be noted, however, that events affecting the general markets, negative or positive reactions to earnings prints and news headlines can quickly invalidate patterns and breakouts. As the saying goes, "the trend is your friend until it isn't" and any trader in a position should have a clear stop set in place and manage their risk versus reward.
In The News: Analysts recently weighed in on the COVID-19 vaccine producers, as the emergence of multiple variants of the infectious disease continue to be identified. On Monday, Deutsche Bank maintains its Hold rating on Moderna and lowered its price target to $155.
On March 3, HC Wainwright & Co. Maintained its Buy rating on Novavax, but lowered the price target to $207.
If the companies were to reach the analysts’ price targets, it would represent a further 10% rise in Moderna’s stock and a whopping 163% climb for Novavax.
See Also: Moderna Plans Vaccines Against 15 Pathogens With Future Pandemic Potential
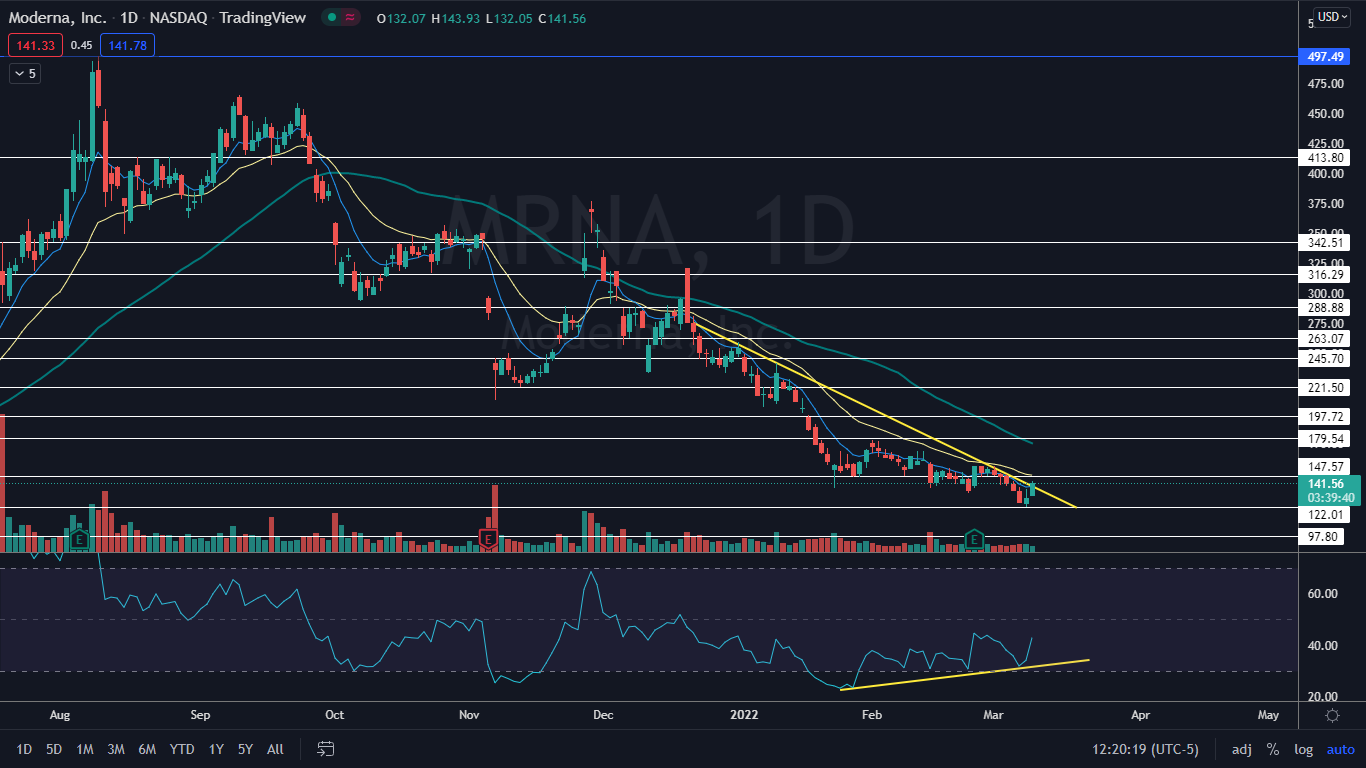
The Moderna Chart: Moderna has been pushed down by a descending trendline since Dec. 21 and on Wednesday the stock was attempting to break up bullishly from the pattern, after hitting a bottom at $122.01 on Tuesday.
- The stock has developed bullish divergence on the daily chart, where the relative strength index (RSI) has formed a series of higher lows, but the stock price has formed multiple lower lows. Bullish divergence often indicates market momentum is strengthening and can mark the bottom of a downtrend.
- On Wednesday, Moderna regained the eight-day exponential moving average (EMA) as support, which should give bulls more confidence going forward. If the stock can regain the 21-day EMA as support on a continued move higher and hold above the area for a period of time, the eight-day EMA will cross above the 21-day EMA, which would be bullish.
- Moderna has resistance above at $147.57 and $179.54 and support below at $122.01 and $97.80.
Want direct analysis? Find me in the BZ Pro lounge! Click here for a free trial.

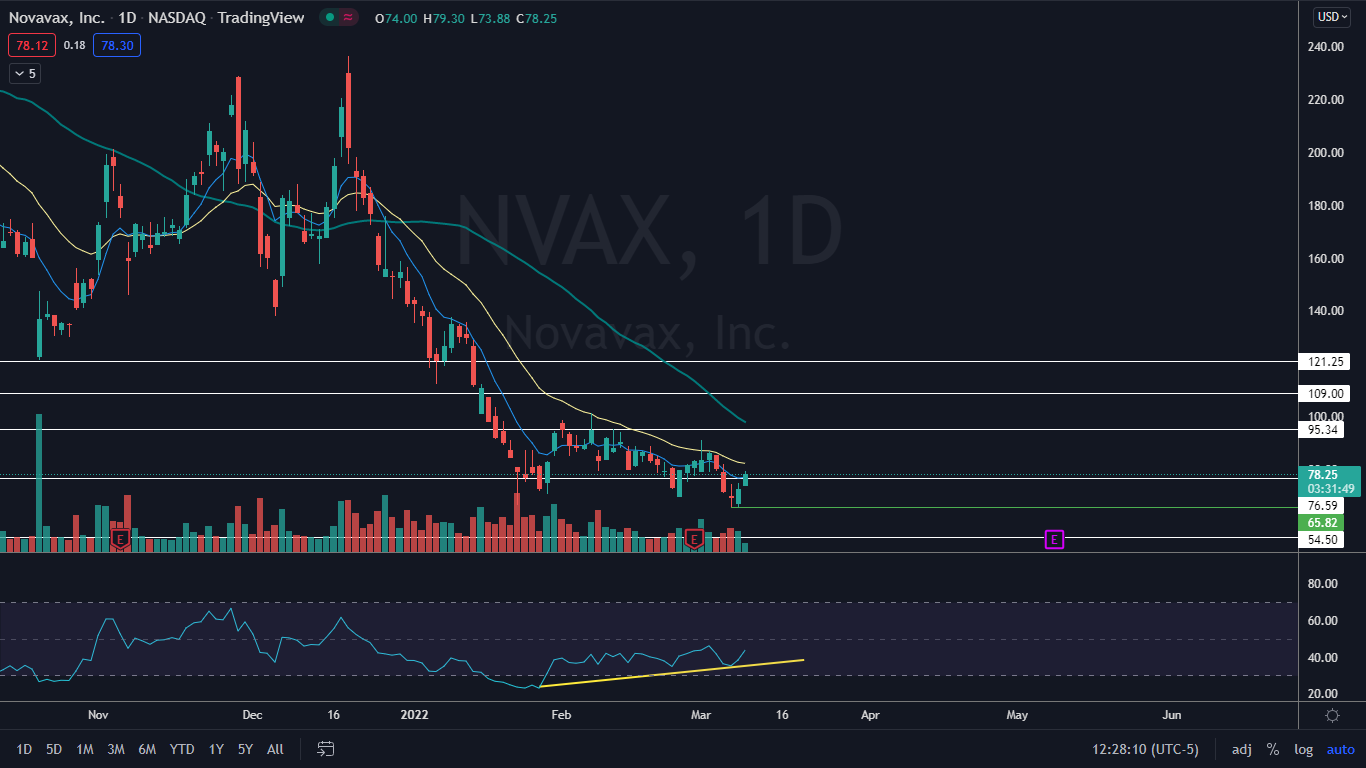
The Novavax Chart: Novavax printed a bullish double bottom pattern on Monday and Tuesday at the 65.82 level and on Wednesday the stock was reacting positively to the formation.
- Like Moderna, Novavax has also developed bullish divergence on its chart, which indicates the stock is likely to trade higher in the future.
- Novavax is trading above the eight-day EMA and also, like Moderna, the stock will need to regain the 21-day EMA in the future to force a bullish cross of the EMAs to occur.
- Novavax has resistance above at $95.34 and $109 and support below at $76.59 and $54.50.

© 2025 Benzinga.com. Benzinga does not provide investment advice. All rights reserved.
Trade confidently with insights and alerts from analyst ratings, free reports and breaking news that affects the stocks you care about.