Zinger Key Points
- Eli Lilly's stock exhibits a short-term bearish trend, trading below key moving averages, indicating potential downside risk.
- Despite bearish signals, analysts maintain a bullish outlook, with price targets suggesting a 15% upside for Eli Lilly stock.
- Brand New Membership Level: Benzinga Trade Alerts
Eli Lilly and Co LLY will be reporting its second-quarter earnings on Thursday. Wall Street expects $2.70 in EPS and $9.9 billion in revenues as the company reports before market hours.
The stock is up 69% over the past year, and has gained 30% YTD.
Let’s look at what the charts indicate for Eli Lilly stock, and how the stock currently maps against Wall Street estimates.
Eli Lilly Stock Faced Potential Downside Risk Ahead Of Q2 Earnings…
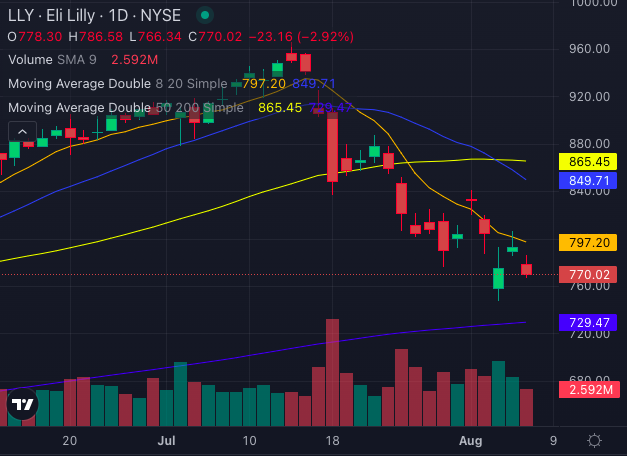
Eli Lilly’s stock is currently exhibiting a strongly bearish trend, as the share price is trading below its 5, 20, and 50-day exponential moving averages. This downward momentum is creating slight selling pressure.

Chart created using Benzinga Pro
Eli Lilly stock is priced at $770.02, which is below its 8-day simple moving average of $797.20, signaling a bearish outlook. Additionally, the stock is trading beneath its 20-day and 50-day simple moving averages, which are at $849.71 and $865.45, respectively, further supporting a bearish technical stance.
However, the stock is above its 200-day simple moving average of $729.47, indicating a bullish signal in the long term.
Read Also: What’s Going On With Eli Lilly And Company Shares Wednesday?

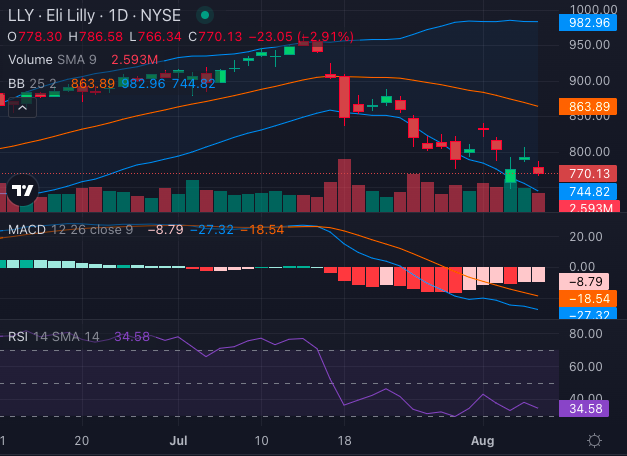
Chart created using Benzinga Pro
The Moving Average Convergence Divergence (MACD) indicator stands at -27.32, reinforcing the bearish sentiment, while the Relative Strength Index (RSI) is at 34.58, suggesting that Eli Lilly stock is approaching oversold territory. The Bollinger Bands, ranging from $744.82 to $982.96, suggest that Eli Lilly is currently facing a bearish market environment.
This combination of technical indicators points to potential downside risk in the short term, despite the long-term upside implied by the 200-day moving average.
Yet Analysts See About 15% Upside
Ratings & Consensus Estimates: The consensus analyst rating on Eli Lilly stock stands at a Buy with a price target of $795.81. The three most recent analyst ratings for Eli Lilly stock were released by Guggenheim and Cantor Fitzgerald have an average price target of $884.67, suggesting a potential 14.84% upside for the stock.
LLY Price Action: Eli Lilly stock was down 3.2% at $766.52 at the time of publication Wednesday.
Read Next:
Photo: rafapress/Shutterstock.com
© 2025 Benzinga.com. Benzinga does not provide investment advice. All rights reserved.
Trade confidently with insights and alerts from analyst ratings, free reports and breaking news that affects the stocks you care about.