Zinger Key Points
- Shares of Expedia (EXPE) are surging on news of a possible take over.
- The shares are extremely overbought and this my draw sellers into the market.
- Get the Real Story Behind Every Major Earnings Report
Shares of Expedia Group, Inc. EXPE are climbing following reports of a potential buyout.
With the stock now overbought, there's a strong chance it could reverse and trend lower. That’s why our team of trading experts has selected it as our Stock of the Day.
Typically, a stock remains within its usual trading range. However, when investors and traders turn emotional and aggressively buy, they can drive the price above this range. In such cases, the stock is considered “overbought.”
Many trading strategies and styles are based on the concept of reversion to the mean. If a stock is overbought, people may start to sell it and this could push the price lower.
There are dozens if not hundreds of ways to measure momentum. They are called indicators. It is important to understand that they are different ways of measuring the same thing. New traders can overcomplicate things by studying too many of them.
Read Also: Goldman Sachs Highlights 20 Top Short-Squeeze Opportunities For Q3 Earnings Season
Some traders have had success by using and mastering just a few of these indicators.

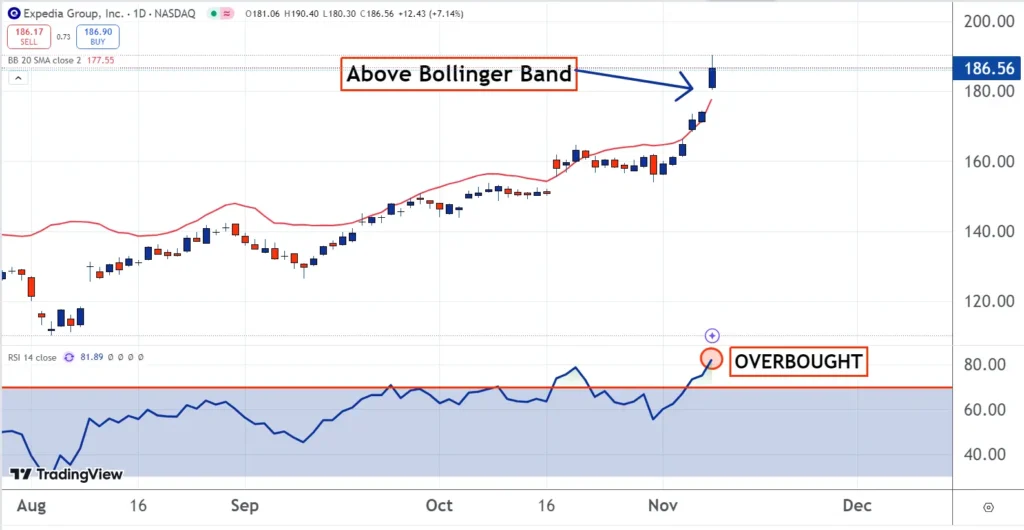
The red line on the chart is called a Bollinger Band. It is two standard deviations above the 20-day moving average. This is important because according to statistics and probability theory, 95% of all trading should be within two standard deviations of the mean.
If a stock exceeds this threshold, as Expedia has done, it will draw sellers into the market. They will be expecting a reversion back towards the average and their selling could put pressure on it.
On the bottom part of the chart is the Relative Strength Index (RSI). It is another way to measure momentum. If the blue line exceeds the horizontal red line, it indicates overbought conditions. As you can see, that is the case now. This could also draw sellers into the market.
Other popular momentum indicators include Moving Average Convergence Divergence (MACD), the Commodity Channel Index (CCI), and Stochastics (TAS). These are all available on Benzinga Pro.
Many rookie traders make things more complicated than they need to be. Part of this is using too many indicators. It may make sense for some traders to only use a few and to become familiar and comfortable with them.
Read Next:
Photo: II.studio/Shutterstock.com
© 2025 Benzinga.com. Benzinga does not provide investment advice. All rights reserved.
Trade confidently with insights and alerts from analyst ratings, free reports and breaking news that affects the stocks you care about.