Zinger Key Points
- American Airlines stock is trading above key moving averages, signaling strong bullish momentum ahead of Q4 earnings.
- With RSI near overbought levels, a short-term pullback could follow before the next bullish leg.
- Pelosi’s latest AI pick skyrocketed 169% in just one month. Click here to discover the next stock our government trade tracker is spotlighting—before it takes off.
American Airlines Group Inc AAL is releasing its fourth-quarter earnings on Thursday. Wall Street expects 64 cents in EPS and $13.40 billion in revenues as the company reports before market hours.
The stock is up 36.01% over the past year, 8.97% YTD.
Let’s look at what the charts indicate for American Airlines stock and how the stock currently maps against Wall Street estimates.
Read Also: This American Airlines Analyst Is No Longer Bearish; Here Are Top 5 Upgrades For Friday
American Airlines Stock Chart Strongly Bullish Ahead of Q4 Earnings
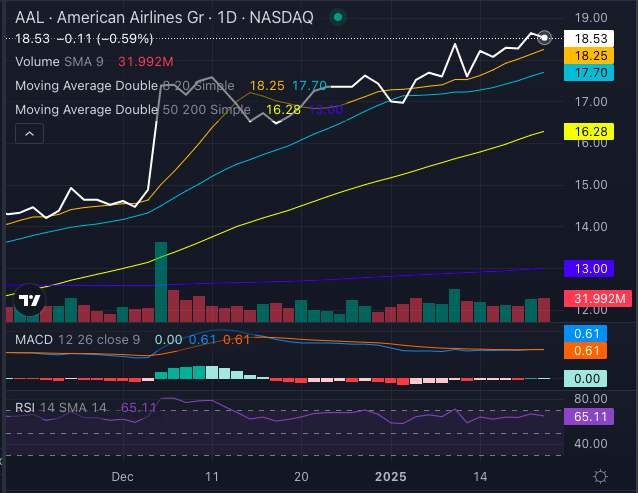
American Airlines stock is exhibiting strong bullish momentum, with its share price consistently trading above key moving averages.

Chart created using Benzinga Pro
At $18.53, American Airlines stock remains above its 5-, 20- and 50-day exponential moving averages, indicating sustained buying pressure. The stock's position above its eight-day simple moving average (SMA) of $18.25 and 20-day SMA of $17.70 suggests continued short-term strength, potentially attracting momentum traders looking for further upside.
From a broader perspective, American Airlines stock significantly outpaces its 50-day SMA of $16.28 and 200-day SMA of $13.00, reinforcing a strong uptrend. This could signal confidence among investors that American Airlines is gaining stability, possibly due to improved sector fundamentals or company-specific catalysts.
Additionally, the MACD (moving average convergence/divergence) indicator at 0.61 aligns with the bullish trend, reflecting strengthening momentum. However, with an RSI (relative strength index) of 65.11, American Airlines stock is approaching overbought conditions, which may indicate a short-term pullback or consolidation before another leg higher.
For investors, these technical signals suggest that American Airlines stock remains on an upward trajectory, but risk management is key. Traders may look for dips as entry points, while longer-term investors could interpret the bullish setup as a sign of improving sentiment around the airline industry.
With American Airlines stock nearing overbought levels, watching for potential resistance or shifts in volume could help navigate the next moves effectively.
American Airlines Analysts See 8% Upside
Ratings & Consensus Estimates: The consensus analyst rating on American Airlines stock stands at a Buy currently with a price target of $18.47. The latest analyst ratings from BofA, Susquehanna and Jefferies imply an 8.2% upside for American Airlines stock.
AAL Price Action: American Airlines stock was trading up 6.22% $18.52 at the time of publication Wednesday.
Read Next:
Photo: Shutterstock
Edge Rankings
Price Trend
© 2025 Benzinga.com. Benzinga does not provide investment advice. All rights reserved.
Trade confidently with insights and alerts from analyst ratings, free reports and breaking news that affects the stocks you care about.